
Fig. 1
- ID
- ZDB-FIG-240528-38
- Publication
- Fetsko et al., 2024 - IL-1β disrupts the initiation of blood-brain barrier development by inhibiting endothelial Wnt/β-catenin signaling
- Other Figures
- All Figure Page
- Back to All Figure Page
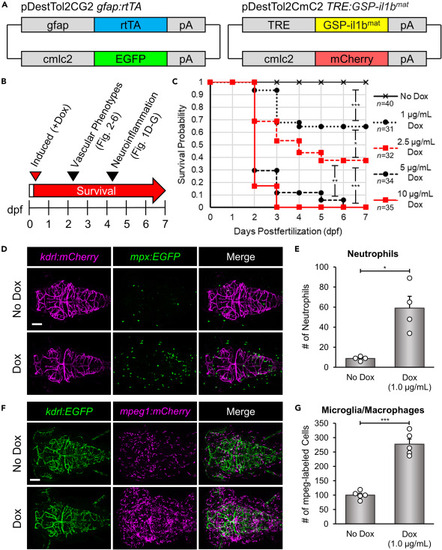
Dox-induced expression of Il-1β in the CNS promotes dose-dependent mortality and neuroinflammation in the transgenic CNS/Il-1β model (A) Design of DNA constructs used to make the zebrafish transgenic lines Tg(gfap:rtTA, cmlc2:EGFP) and Tg(TRE:GSP-il1bmat, cmlc2:mCherry). The combination of these transgenic lines is designated as “CNS/Il-1β” to indicate doxycycline (Dox) inducible expression of Il-1β in the CNS. (B) Experimental timeline for all experiments. This graphic represents the timing of Dox induction and in vivo imaging. Dox (0–10 μg/mL) was added at approximately 6 hpf for all experiments. Survival was monitored daily through 7 dpf. Confocal imaging was performed at 4 dpf for neuroinflammation (Figures 1D and 1F) and at 2 dpf for imaging brain vasculature (Figures 2, 3, 4, 5, and 6). (C) Kaplan-Meier analysis monitoring survival probability. CNS/Il-1β embryos were treated with Dox at 0, 1, 2.5, 5, or 10 μg/mL at 6 hpf, then monitored for survival every day until 7 dpf (∗p < 0.05; ∗∗p < 0.01; ∗∗∗p < 0.001; not all comparisons are shown). (D) Representative confocal microscopy images showing neutrophils (mpx:EGFP) and blood vessels (kdrl:mCherry) in the head. CNS/Il-1β embryos were untreated (No Dox) or treated (Dox; 1.0 μg/mL) at 6 hpf and then imaged at 4 dpf (dorsal view; anterior left). Scale bar is 100 μm. (E) Quantification of neutrophils (mpx:EGFP) in the heads of untreated (No Dox) or treated (Dox; 1.0 μg/mL) CNS/Il-1β larvae at 4 dpf (n=4). (F) Representative confocal microscopy images showing microglia/macrophages (mpeg1:mCherry) and blood vessels (kdrl:EGFP) in the head for context. CNS/Il-1β embryos at 6 hpf were either untreated (No Dox) or treated (Dox; 1.0 μg/mL), then imaged at 4 dpf (dorsal view; anterior left). Scale bar is 100 μm. (G) Quantification of microglia/macrophages (mpeg1:mCherry) in the heads of untreated (No Dox) or treated (Dox; 1.0 μg/mL) CNS/Il-1β larvae at 4 dpf (n=5). Error bars in E and G represent means ± SEM (∗p < 0.05; ∗∗∗p < 0.001). |