
Fig. 6
- ID
- ZDB-FIG-240528-43
- Publication
- Fetsko et al., 2024 - IL-1β disrupts the initiation of blood-brain barrier development by inhibiting endothelial Wnt/β-catenin signaling
- Other Figures
- All Figure Page
- Back to All Figure Page
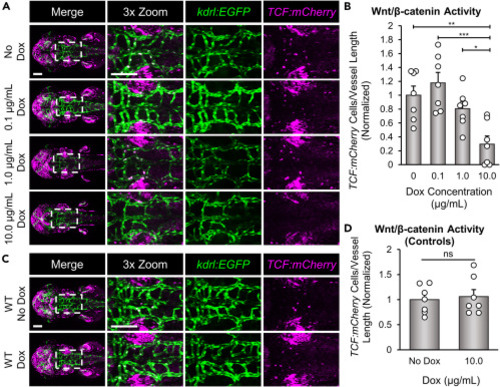
Il-1β reduces Wnt/β-catenin transcriptional activation in brain endothelial cells (A) Representative confocal microscopy images showing Wnt/β-catenin transcriptional activity. CNS/Il-1β, kdrl:EGFP, TCF:mCherry embryos were untreated (No Dox) or treated with Dox (0.1, 1.0, or 10.0 μg/mL) at 6 hpf and then imaged at 52 hpf (dorsal view; anterior left). Scale bars are 100 μm. (B) Quantification of TCF:mCherry-positive endothelial cells in the hindbrain vasculature (n = 7). Values are the number of TCF:mCherry-positive cells in kdrl:EGFP-positive blood vessels divided by the length of the hindbrain vasculature in each embryo. All values were normalized to the average of the No Dox group. (C) Representative confocal microscopy images showing control kdrl:EGFP, TCF:mCherry embryos (no CNS/Il-1β) at 2 dpf (dorsal view; anterior left). Embryos were either untreated (No Dox) or treated with 10.0 μg/mL (Dox) at 6 hpf. (D) Quantification of TCF:mCherry-positive endothelial cells in the hindbrain vasculature (n = 7). Values are the number of TCF:mCherry-positive cells in kdrl:EGFP-positive blood vessels divided by the length of the hindbrain vasculature in each embryo. All values were normalized to the average of the No Dox group. Scale bars for A and C are 100 μm. Error bars in B and D represent means ± SEM (∗p < 0.05; ∗∗p < 0.01; ∗∗∗p < 0.001; ns or not labeled = not significant). |