
Fig. 3
- ID
- ZDB-FIG-240528-40
- Publication
- Fetsko et al., 2024 - IL-1β disrupts the initiation of blood-brain barrier development by inhibiting endothelial Wnt/β-catenin signaling
- Other Figures
- All Figure Page
- Back to All Figure Page
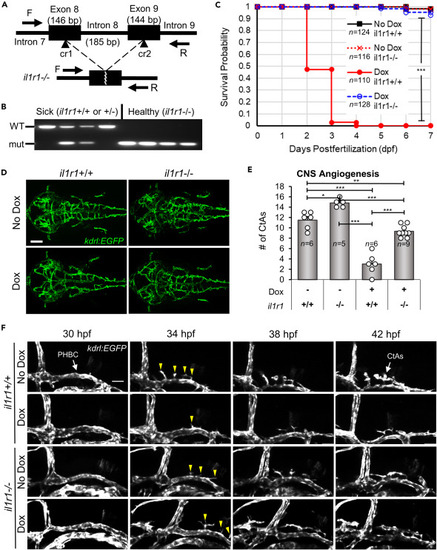
CRISPR/Cas9 il1r1 mutants rescue Il-1β-induced mortality and CNS angiogenesis (A) Schematic of the zebrafish il1r1 gene showing the locations targeted by the CRISPR/Cas9 RNP complexes (cr1 and cr2) (top) and the resulting deletion of intron 8 (bottom). The exon and intron sizes in base pairs (bp) and the forward and reverse primers (F and R) used for genotyping are shown (not to scale). (B) PCR showing the genotyping of CRISPR/Cas9 deletion of il1r1. CNS/Il-1β embryos from heterozygous il1r1+/− adults were treated with Dox (10.0 μg/mL), selected as sick or healthy, and then genotyped by PCR. Note that all healthy embryos have the il1r1−/− deletion and all sick embryos carry a wild-type il1r1 allele. (C) Kaplan-Meier analysis monitoring survival probability of il1r1 mutants. CNS/Il-1β embryos either il1r1+/+ or il1r1−/− were untreated (No Dox) or treated (Dox; 10.0 μg/mL) at 6 hpf and then monitored for survival every day until 7 dpf (∗∗∗p < 0.001; not all comparisons are shown). (D) Representative confocal microscopy images showing rescue of CNS angiogenesis in Dox-induced il1r1 deletion mutants. CNS/Il-1β, kdrl:EGFP embryos either il1r1+/+ or il1r1−/− were untreated (No Dox) or treated (Dox 10 μg/mL) at 6 hpf and then imaged at 54 hpf (dorsal view; anterior left). Scale bars are 100 μm. (E) Quantification of the number of CtAs in wild-type il1r1 (+/+) and mutant il1r1 (−/−) embryos either treated with no Dox (−) or treated with 10.0 μg/mL Dox (+). Error bars represent means ± SEM (∗p < 0.05; ∗∗p < 0.01; ∗∗∗p < 0.001; no label = not significant). (F) Still frames from time-lapse confocal imaging of CNS/Il-1β, kdrl:EGFP embryos either il1r1+/+ or il1r1−/− without (No Dox) or with (10.0 μg/mL Dox) treatment (lateral view; dorsal top; anterior left). Shown here are snapshots at 4-h intervals over 12 h of acquisition beginning at the onset of CNS angiogenesis (30 hpf). Stereotypical tip cells are indicated at 34 hpf (yellow arrowheads). See Videos S1, S2, S3, and S4 for more detail. |