
Fig. 4
- ID
- ZDB-FIG-240528-41
- Publication
- Fetsko et al., 2024 - IL-1β disrupts the initiation of blood-brain barrier development by inhibiting endothelial Wnt/β-catenin signaling
- Other Figures
- All Figure Page
- Back to All Figure Page
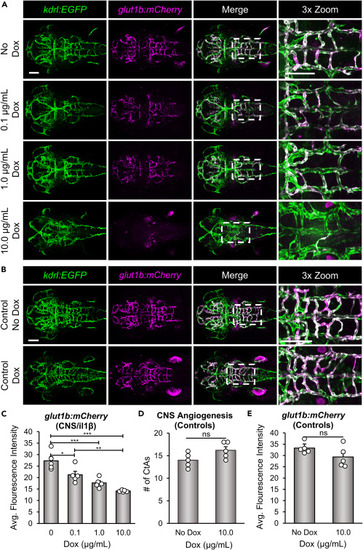
Il-1β disrupts glut1b:mCherry expression in brain endothelial cells during CNS angiogenesis (A) Representative confocal microscopy images showing Dox-dependent effects on glut1b:mCherry expression. CNS/Il-1β, kdrl:EGFP, glut1b:mCherry embryos were untreated (No Dox) or treated with Dox (0.1, 1.0, or 10.0 μg/mL) at 6 hpf and then imaged at 52 hpf (dorsal view; anterior left). Scale bars are 100 μm. (B) Representative confocal microscopy images showing control kdrl:EGFP, glut1b:mCherry embryos (no CNS/Il-1β) at 2 dpf. Embryos were either untreated (No Dox) or treated with 10.0 μg/mL (Dox) at 6 hpf. Scale bars are 100 μm. (C) Quantification of the average glut1b:mCherry fluorescence intensity in the hindbrain vasculature of CNS/Il-1β, kdrl:EGFP, glut1b:mCherry embryos at 2 dpf (n = 5). Note the dose-dependent decrease in glut1b:mCherry signal indicating a defect in barriergenesis. (D and E) Quantification of the number of CtAs (D) and average glut1b:mCherry fluorescence intensity (E) in the hindbrain vasculature of control kdrl:EGFP, glut1b:mCherry embryos (no CNS/Il-1β) without (No Dox) or with (10.0 μg/mL Dox) treatment (n = 5). Note that Dox alone has no impact on barriergenesis. Error bars in C, D, and E represent means ± SEM (∗p < 0.05; ∗∗p < 0.01; ∗∗∗p < 0.001; ns or no label = not significant). |