Fig. 9
|
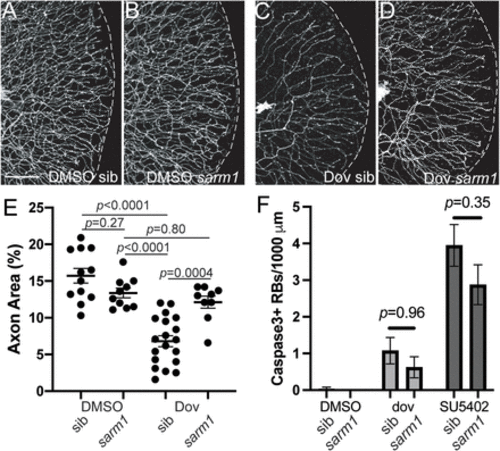
Sarm1 mediates dovitinib-induced axon degeneration. A–D, Lateral views of RB:GFP caudal tails at 5 dpf of wild-type (A,C) or sarm1−/− mutants (B,D) treated with DMSO or dovitinib (3–5 dpf treatment). Compared to wildtype siblings treated with dovitinib, sarm1 mutants had substantially higher GFP+ RB axon density. Scale bar = 50 μm. E, Quantification of axon density in dovitinib treatment of sarm1 mutants. DMSO sib = 15.7 ± 1.0%, DMSO sarm1 13.4 ± 0.7%, dovitinib sib = 6.8 ± 0.8%, dovitinib sarm1 = 12.1 ± 0.8. Analysis by 2-way ANOVA with Tukey's multiple-comparisons test revealed there was a significant interaction between drug treatment and sarm1 genotype (F(1,46) = 18.82, p < 0.0001) and simple main effects analysis showed drug treatment had a significant effect (p < 0.0001) but sarm1 genotype did not (p = 0.10). F, Quantification of RB apoptosis with dovitinib and SU5402 treatments of sarm1 mutants. Sarm1 mutants did not have significantly different numbers of Cas3+ RBs than siblings. DMSO sib = 0.0 ± 0.0, N = 17, DMSO sarm1 = 0.0 ± 0.0, N = 22, dovitinib sib = 1.1 ± 0.4, N = 22, dovitinib sarm1 = 0.6 ± 0.3, N = 19. SU5402 sib = 4.0 ± 0.6, N = 21, SU5402 sarm1 = 2.9 ± 0.5, N = 23. Analysis by 2-way ANOVA with Tukey's multiple-comparisons test revealed there was no significant interaction between drug treatment and sarm1 genotype (F(2,188) = 0.88, p = 0.42) and simple main effects analysis showed drug treatment did have a significant effect (p < 0.0001) but sarm1 genotype did not have a significant effect (p = 0.11). |

