Fig. 1
|
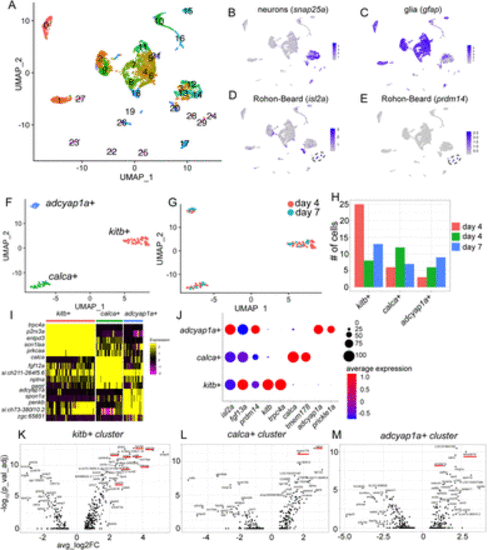
Identification of transcriptionally distinct RB subpopulations. A, Unsupervised clustering and UMAP reduction diagram of cells derived from trunks of day 4 (Kelly et al., 2023) and day 7 larvae. B,C, Feature plots identifying neurons (B) and glia (C). D,E, Feature plots of two RB markers, isl2a and prdm14, identifying clusters 24 and 29 as RBs. F,G, Unsupervised subclustering and UMAP reduction diagram of RB cells. H, Bar plot showing cell numbers for each cluster. I, Heat map showing top five DE genes for each cluster. J, Dot plot profile of genes expressed in all RBs (isl2a, fgf13a, and prdm14), kitb+ cluster (kitb and trpc4a), calca+ cluster (calca and tmem178), and adcyap1a+ cluster (adcyap1a and prickle1a). K–M, Volcano plots showing top DE genes in each RB cluster. |

