|
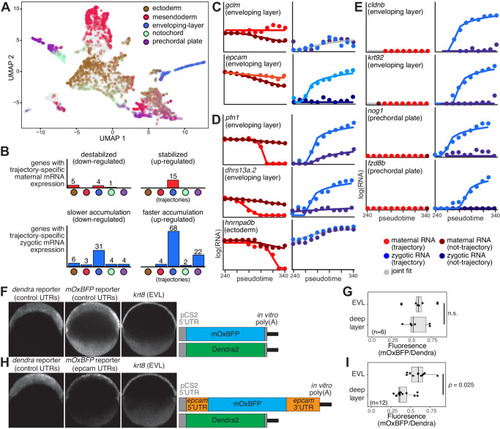
Trajectory specific regulatory kinetic rates of embryonic genes. A A UMAP projection of 8226 single cells with five cell lineages (colors as indicated). Each cell is colored by its lineage assignments. B Histograms (y-axis; number of genes) of trajectory-specific maternal (red, top) and zygotic (blue, bottom) significantly differentially regulated genes, per trajectory (x-axis, color-coded as in (A)). Each set of trajectory-specific genes is divided into up-regulated (right) and down-regulated (left) genes. Some genes are differentially regulated in more than one trajectory. C–E Trajectory-specific model fits (solid lines) to interpolated zygotic (right) trajectory (light blue dots) or non-trajectory (dark blue dots) and maternal (left) trajectory (light red dots) or non-trajectory (dark red dots) expression levels (y-axis, log2 scale) across 11 pseudotime bins (x-axis) for genes with trajectory specific regulation. Expression levels were interpolated separately for cells that are assigned to a trajectory or those not assigned to it across 11 pseudotime bins. Gene name and trajectory are indicated on top. Gray lines represent fits that match both trajectory and non-trajectory data, and therefore retain the null hypothesis of similar regulation within and outside a trajectory. F Left: hybridization chain reaction (HCR) in situs against dendra mRNA with “neutral“ UTRs, mOxBFP mRNA with “neutral UTRs”, and krt8 that marks enveloping layer (EVL) cells. Right: diagrams of injected reporter mRNAs. G Quantification of ratio of mOxBFP to dendra HCR fluorescence in the enveloping layer (EVL) and deep layer (rest of the blastoderm) in “neutral” UTR reporter injections from n = 6 independent embryos. Box plots show median (line), 1st and 3rd quartiles (hinges), and 1.5 inter-quartile ranges (whiskers). Significance was calculated using a two-sided Student’s t test. Each sample was measured twice in the two different regions. H, I Similar to (F, G), except using mOxBFP mRNA with epcam UTRs in n = 12 independent embryos.
|