|
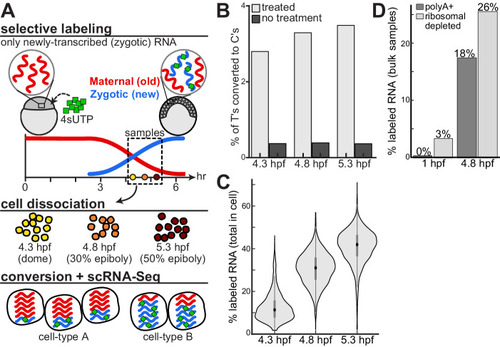
Monitoring the embryonic maternal and zygotic transcriptomes at a single cell resolution. A An approach to combine scRNA-Seq with RNA metabolic labeling in zebrafish embryos. We injected zebrafish embryos at the one-cell stage with 4sU-triphosphate (4sUTP, green), which is selectively incorporated into newly-transcribed zygotic mRNA molecules (blue), while preexisting maternally contributed molecules (red) remain unlabeled. We collected embryos at three developmental stages following the onset of zygotic transcription: dome (4.3 hpf; yellow), 30% epiboly (4.8 hpf; orange) and 50% epiboly (5.3 hpf; dark red). We dissociated embryos into single cells, and measured their transcriptomes by an adapted scRNA-Seq workflow that included a chemical conversion of labeled residues. Conversion induced T-to-C changes in downstream sequencing reads, enabling the separate quantification of newly-transcribed (zygotic) and pre-existing (maternal) mRNA within single-cell transcriptomes. B Fraction of T bases that were sequenced as C (y-axis) across all genes in the transcriptome, within each of three temporal samples (x-axis), when applying chemical conversion (light gray) or without such treatment (dark gray). C Distribution of GRAND-SLAM estimates of the overall percent of labeled RNA within each cell (y-axis) at three developmental stages (x-axis). The central dot is median; gray box bounds are 25th and 75th percentiles, upper and lower limits of whiskers are 1.5x interquartile ranges. Values outside of the upper and lower limits are defined as outliers, n = 1855, 3052, and 3319 cells per stage, respectively. D GRAND-SLAM estimates of percent of total labeled RNA per sample (y-axis) in bulk samples collected at two developmental stages (1 hpf, 4 cell, and 4.8 hpf, 30% epiboly) using either polyA selection (dark gray) or ribosomal depletion (light gray).
|