|
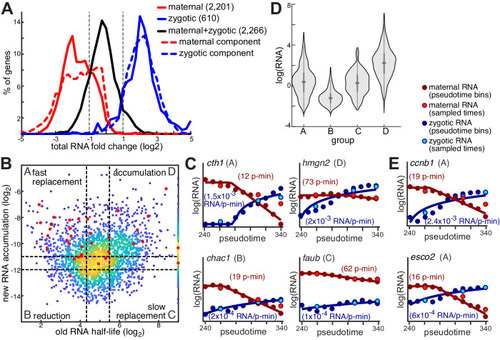
Different replacement strategies between maternal and zygotic copies of embryonic genes underlie overall mRNA levels with fewer changes. A Distribution of total RNA fold-change (x-axis, log2) between average expression in three first pseudotime bins and three last pseudotime bins, of maternal-only (solid red), zygotic-only (solid blue) and maternal-zygotic (solid black) genes, as well as the separate maternal (dashed red) and zygotic (dashed blue) components of total maternal-zygotic RNA levels. Positive fold-change values represent an increase and negative values represent a decrease in mRNA levels over time. B Scatter plot of maternal mRNA half-lives (x-axis, log2) and zygotic mRNA accumulation (y-axis, log2) for maternal-zygotic genes. Colors represent density (yellow = high density; blue = low density). Red dots indicate genes that are included in the set of 154 genes with a cell-type-specific expression. Dashed lines represent lower and upper bounds for defining four groups of genes within this set A–D (half-life bounds: <20 pseudo-min or >45 pseudo-min; log2 accumulation bounds: <−12 or >−11). C Model fits for one gene in each group (as indicated). Plots show model fits (solid lines) to interpolated zygotic (blue dots) and maternal (red dots) expression levels (y-axis, log2 scale) across 11 pseudotime bins (x-axis). Gene names, accumulation pseudo-rates and pseudo-half-lives are indicated. Light blue and light red dots represent estimated zygotic and maternal mRNA levels, respectively, for three sampled timepoints (4.3 hpf, 4.8 hpf and 5.3 hpf). D Distribution of total mRNA expression levels (y-axis, log2) for genes in each of the groups A-D (x-axis). The central dot is the median; gray box bounds are 25th and 75th percentiles, upper and lower limits of whiskers are upper and lower limits of whiskers are 1.5x interquartile ranges. Values outside of the upper and lower limits are defined as outliers, n = 284, 183, 162, and 519 genes in groups A–D, respectively. E Model fits (as in C) for two genes with fast replacement in group A, whose expression is restricted to specific phases of the cell cycle.
|