IMAGE

Fig. 6

ID
ZDB-IMAGE-240412-20
Source
Figures for Fishman et al., 2024
Image
Figure Caption

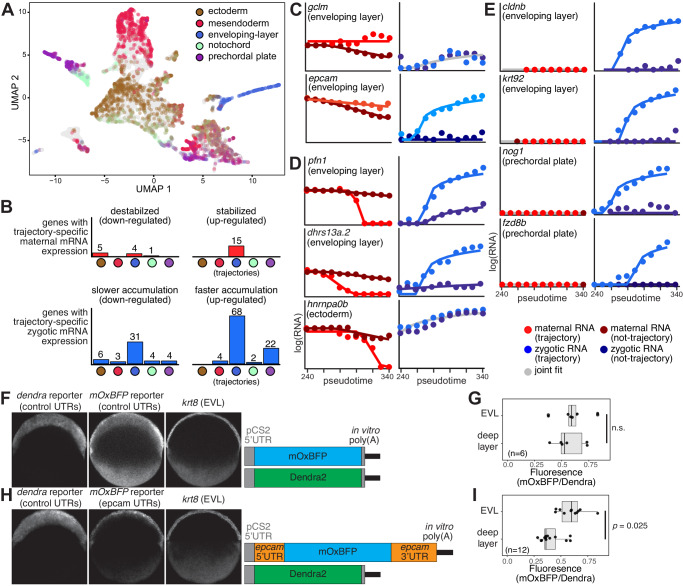
Fig. 6 Trajectory specific regulatory kinetic rates of embryonic genes.

A A UMAP projection of 8226 single cells with five cell lineages (colors as indicated). Each cell is colored by its lineage assignments. B Histograms (y-axis; number of genes) of trajectory-specific maternal (red, top) and zygotic (blue, bottom) significantly differentially regulated genes, per trajectory (x-axis, color-coded as in (A)). Each set of trajectory-specific genes is divided into up-regulated (right) and down-regulated (left) genes. Some genes are differentially regulated in more than one trajectory. CE Trajectory-specific model fits (solid lines) to interpolated zygotic (right) trajectory (light blue dots) or non-trajectory (dark blue dots) and maternal (left) trajectory (light red dots) or non-trajectory (dark red dots) expression levels (y-axis, log2 scale) across 11 pseudotime bins (x-axis) for genes with trajectory specific regulation. Expression levels were interpolated separately for cells that are assigned to a trajectory or those not assigned to it across 11 pseudotime bins. Gene name and trajectory are indicated on top. Gray lines represent fits that match both trajectory and non-trajectory data, and therefore retain the null hypothesis of similar regulation within and outside a trajectory. F Left: hybridization chain reaction (HCR) in situs against dendra mRNA with “neutral“ UTRs, mOxBFP mRNA with “neutral UTRs”, and krt8 that marks enveloping layer (EVL) cells. Right: diagrams of injected reporter mRNAs. G Quantification of ratio of mOxBFP to dendra HCR fluorescence in the enveloping layer (EVL) and deep layer (rest of the blastoderm) in “neutral” UTR reporter injections from n = 6 independent embryos. Box plots show median (line), 1st and 3rd quartiles (hinges), and 1.5 inter-quartile ranges (whiskers). Significance was calculated using a two-sided Student’s t test. Each sample was measured twice in the two different regions. H, I Similar to (F, G), except using mOxBFP mRNA with epcam UTRs in n = 12 independent embryos.

Acknowledgments
This image is the copyrighted work of the attributed author or publisher, and ZFIN has permission only to display this image to its users. Additional permissions should be obtained from the applicable author or publisher of the image. Full text @ Nat. Commun.