|
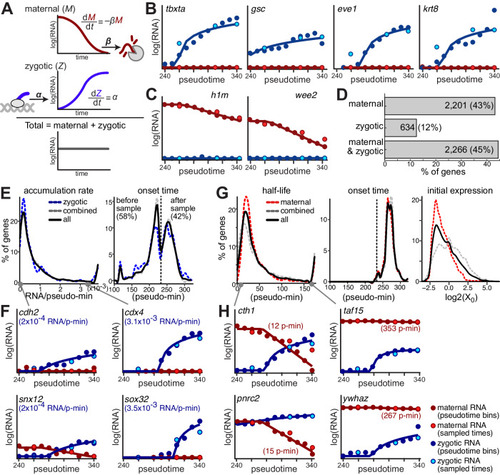
Maternal and zygotic mRNA regulatory kinetic rates shape their temporal expression patterns. A A kinetic modeling approach to infer per-gene maternal and zygotic kinetic rates. Levels of maternal mRNA (M, red) are determined by an exponential decay of preexisting copies with a constant degradation rate (β). Levels of zygotic transcripts (Z, blue) are determined by a linear accumulation, with a constant accumulation rate (α). Total mRNA levels (gray) are the sum of maternal and zygotic mRNA. Model fits (solid lines) to interpolated zygotic (blue dots) and maternal (red dots) expression levels (y-axis, log2 scale) across 11 pseudotime bins (x-axis) for key developmental genes. Gene name and predicted accumulation pseudo-rate are indicated. Light blue and light red dots represent estimated zygotic and maternal mRNA levels, respectively, for three sampled timepoints (4.3 hpf, 4.8 hpf and 5.3 hpf). B Zygotic regulators. C Maternally provided transcripts. D Histogram for number of genes (x-axis, fraction) that fit only a maternal model (top), only a zygotic model (middle) or both (bottom). Numbers and percentages are indicated. E Distribution of two parameters of the zygotic accumulation model across genes. Left: accumulation pseudo-rate (transcripts/pseudo-min, x-axis) per gene (y-axis, fraction). Right: transcription onset time (pseudo-min, x-axis) per gene (y-axis, fraction). Time of earliest pseudotime bin in our data (240 min.) is indicated. Distributions are shown for all genes (black), zygotic only genes (blue) and combined maternal and zygotic genes (gray). F Model fits (as in B) for genes with very low (left) or very high (right) accumulation pseudo-rates. G Distribution of three parameters of the maternal decay model across genes. Left: degradation pseudo-rate (half-life, pseudo-min, x-axis) per gene (y-axis, fraction). Middle: degradation onset time (pseudo-min, x-axis) per gene (y-axis, fraction). Time of earliest pseudotime bin in our data (240 min) is indicated. Right: initial expression level (log2, x-axis) per gene (y-axis, fraction). Distributions are shown for all genes (black), maternal only genes (red) and combined maternal and zygotic genes (gray). H Model fits (as in B) for genes with very short (left) or very long (right) half-lives.
|