|
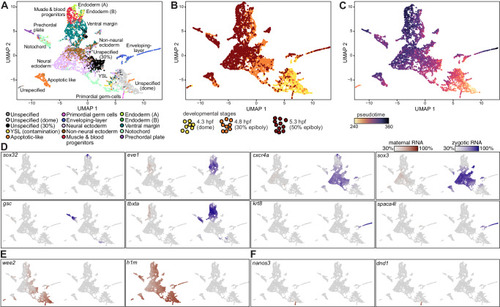
Distinguishing maternal and zygotic expression across single cells of zebrafish embryos. UMAP projection of 8226 single cells from five embryonic samples (4.3 hpf, 1855 cells; 4.8 hpf, 3052 cells from 2 replicates; 5.3 hpf, 3319 cells from 2 replicates). A Colored by 13 distinct cell-type clusters. Three groups of unspecified cells do not express any specific cell-type markers, and represent cells which have still not differentiated. Two of these groups mostly include cells from one specific developmental stage, as indicated. Cells labeled as YSL are likely a contamination that originated from the yolk syncytial layer. Unspecified cells are either from 30% epiboly or dome stages. B Colored by developmental stage: 4.3 hpf (dome, 1855 cells, yellow); 4.8 hpf (30% epiboly, 3052 cells, 2 replicates, orange); 5.3 hpf, (50% epiboly, 3319 cells, 2 replicates, dark red). C Colored by pseudotime. Values range from 240 pseudo-min (earliest, yellow) to 360 pseudo-min (latest, purple). Pseudotime was calculated using the URD algorithm, based on the cells’ transcriptomic differences from the early unspecified cell populations. D–F Single-cell expression of developmental genes across all 8226 collected single cells. All cells are plotted, and each cell is colored by the normalized expression of a gene’s pre-existing maternal copies (red, left map) or newly-transcribed zygotic copies (blue, right map). The characteristically low label incorporation rates in combination with low per-cell number of reads by scRNA-Seq, limited the accuracy of estimated labeled mRNA fraction within single cells, which was often lower than expected within single cells and resulted in an unlabeled mRNA background. Therefore, we use a gene-specific color scale, scaled by its maximal total expression, and its minimal 30% quantile of maternal and zygotic mRNA expression. Analyzed genes are indicated on plot. D Zygotically expressed genes, known to be specifically expressed within a certain lineage. E Maternally inherited genes. F Maternally inherited genes, known to be specifically expressed within germ cells.
|