|
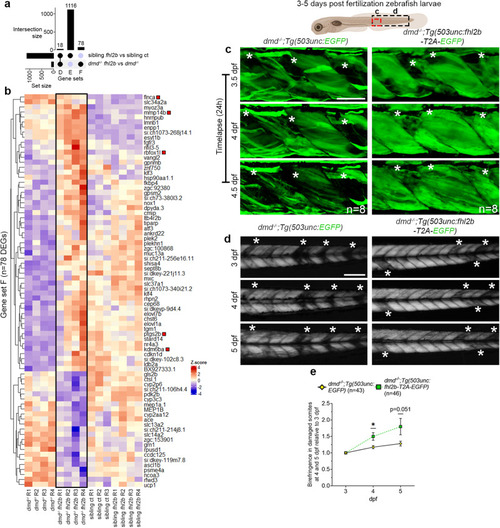
fhl2b overexpression leads to upregulation of regenerative markers in dmd−/− zebrafish larvae. a Upset plot showing the intersection of DEGs between Tg(503unc:fhl2b-T2A-EGFP) vs sibling controls and dmd−/−:Tg(503unc:fhl2b-T2A-EGFP) vs dmd−/− larvae (Gene set D: DEGs caused by fhl2b overexpression in both comparisons; Gene set E: DEGs caused by fhl2b overexpression in healthy sibling control conditions alone; Gene set F: DEGs caused by fhl2b overexpression in the dmd−/− disease condition). b Heatmap displaying the expression of DEGs in Gene set F. Red boxes indicate DEGs related to muscle regeneration. c Timelapse images of dmd−/−;Tg(503unc:EGFP) and dmd−/−;Tg(503unc:fhl2b-T2A-EGFP) larvae at 3.5, 4 and 4.5 dpf, respectively. Asterisks (*) indicate damaged somites. Area viewed is indicated in zebrafish illustration above. d Birefringence images following the same dmd−/−;Tg(503unc:EGFP) and dmd−/−;Tg(503unc:fhl2b-T2A-EGFP larvae at 3, 4 and 5 dpf. Asterisks (*) indicate damaged somites. Trunk region viewed is indicated in zebrafish illustration above. E Quantification of birefringence in damaged somites over time. Birefringence at 4 and 5 dpf was compared to 3 dpf in order to evaluate muscle regeneration progression over time. p = 0.012 at 4 dpf and p = 0.051 at 5 dpf. Statistical analysis in e, f: Two-sided Wald test with B/H-correction, k, l, o, p: Two-sided t-test with Welsh correction. Scale bar in c: 50 µm and d: 200 µm. Schematic images were adapted from https://www.biorender.com.
|