|
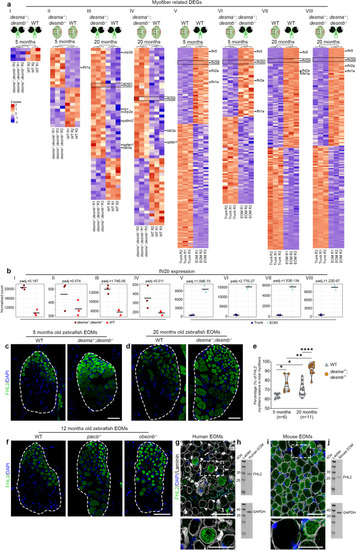
fhl2b is upregulated in the EOM in response to desmin-related muscular dystrophy. a Expression of myofiber-related DEGs for the following comparisons: 5 months desma−/−:desmb−/−vs WT EOMs (I), 5 months desma−/−:desmb−/−vs WT trunk (II), 20 months desma−/−:desmb−/−vs WT EOMs (III), 20 months desma−/−:desmb−/−vs WT trunk (IV), 5 months WT EOMs vs WT trunk (V), 5 months desma−/−:desmb−/− EOMs vs desma−/−:desmb−/− trunk (VI), 20 months WT EOMs vs WT trunk (VII) and 20 months desma−/−:desmb−/− EOMs vs desma−/−:desmb−/− trunk (VIII). bfhl2b expression in the abovementioned comparisons I-VIII. FHL2 antibody labeling of WT and desma−/−;desmb−/− cross-sectioned EOMs at c 5 and d 20 months. e FHL2 positive myofibers quantification of desma−/−;desmb−/− versus WT control EOMs in 5 (p = 0.017) and 20-monthold zebrafish (p = 3.7e−7), respectively and 5-months versus 20-months-old WT (p = 0.014) and desma−/−:desmb−/− (p = 0.005), respectively. Data is presented as median (line) and quartiles (dashed lines). f WT, plecb−/− and obscnb−/− 12-month-old EOM cross sections immunolabeled with FHL2 antibodies. g Human EOM cross section immunolabeled with DAPI/FHL2/laminin antibodies, dashed square indicates area enlarged below. h Western blot on human EOMs showing FHL2. i Mouse EOM cross section immunolabeled using DAPI/FHL2/laminin antibodies, dashed boxes indicate area enlarged below. j Western blot of mouse EOMs showing FHL2. Statistical analysis in b: Two-sided Wald test with B/H-correction, e: Two-sided t-tests with Welch correction. Scale bars in c, d, f, g, i: 50 µm, g, i bottom panel: 25 µm. White dashed lines outline the entire cross-section of the EOMs. Schematic images were adapted from https://www.biorender.com.
|