|
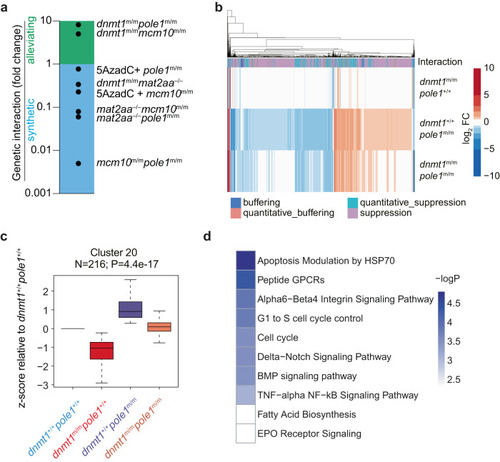
Genetic interaction analysis. a Summary of genetic interaction analyses for the indicated pairs using the rag/gh ratio as parameter; fold changes are shown relative to the default state (1; no interaction). The multiplicative model was used throughout (see Methods). b Global gene expression analysis in the indicated genotypes; the type of genetic interaction follows the nomenclature in86. c Expression pattern of co-regulated genes in cluster #20 in fish of the indicated genotypes. The numbers of genes per cluster are indicated; box plots (mean; box, upper/lower quartile; whiskers, minimal/maximal values). d Pathway analysis of genes in cluster #20 of co-regulated genes (see Supplementary Fig. 23 for full STEM analysis).
|