FIGURE

Fig. 9

ID
ZDB-FIG-240109-80
Publication
Lawir et al., 2024 - Antagonistic interactions safeguard mitotic propagation of genetic and epigenetic information in zebrafish
Other Figures
All Figure Page
Back to All Figure Page
Fig. 9

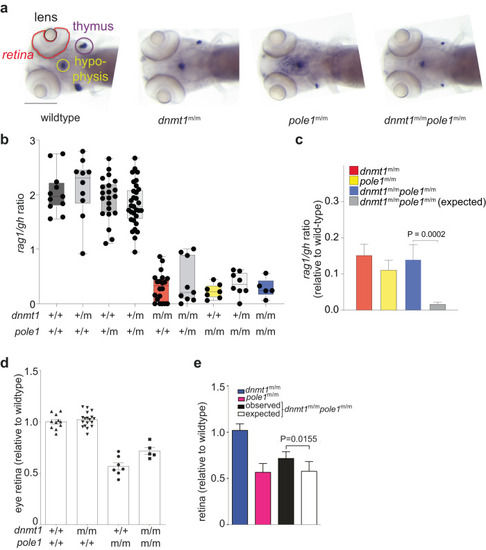
Epistasis analysis of dnmt1 and pole1 mutations.

a Whole-mount RNA in situ hybridization results of larvae of the indicated genotypes are shown (rag1 signal in thymus [indicated by purple circle]; gh signal in hypophysis [indicated by light green circle]). The lens and retina are outlined. Scale bar, 1 mm. b Representation of rag1/gh ratios of fish with the indicated genotypes (each symbol represents an individual fish); mean±s.e.m. c Quantitative analysis of data in (a) (mean±s.d.; t-test; two-tailed); alleviating interaction according to the multiplicative model (see Methods) is demonstrated. d Relative size of retinas of fish with the indicated genotypes (each symbol represents an individual fish; mean±s.e.m. e Quantitative analysis of data in (d) (mean±s.d.; t-test; two-tailed); alleviating interaction according to the multiplicative model (see Methods) is demonstrated.

Expression Data

Expression Detail
Antibody Labeling
Phenotype Data

Phenotype Detail
Acknowledgments
This image is the copyrighted work of the attributed author or publisher, and ZFIN has permission only to display this image to its users. Additional permissions should be obtained from the applicable author or publisher of the image. Full text @ Commun Biol