FIGURE

Fig. 8

ID
ZDB-FIG-240109-79
Publication
Lawir et al., 2024 - Antagonistic interactions safeguard mitotic propagation of genetic and epigenetic information in zebrafish
Other Figures
All Figure Page
Back to All Figure Page
Fig. 8

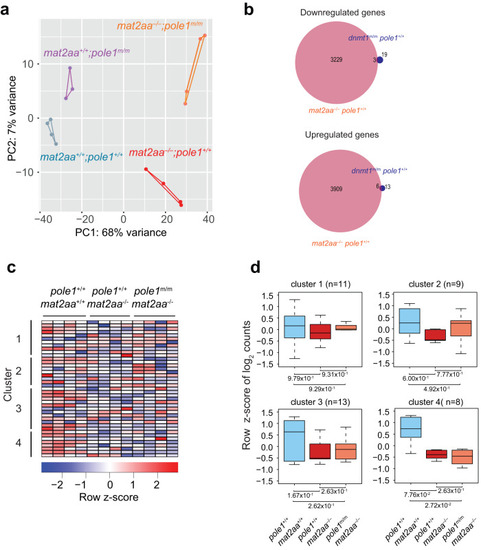
Transcriptional landscapes in mat2aa and pole1 mutants.

a Dynamic changes in transcriptomes of mat2aa and pole1 single and double mutants, as indicated by principal component analysis. b Venn diagram indicating the overlap of differentially expressed genes for down-regulated and up-regulated genes in fish of the indicated genotypes. c Expression patterns of genes in the four clusters of co-regulated genes identified in dnmt1 mutant fish; each column represents a biological replicate. d No restoration of expression levels in mat2aa/pole1 double mutants for the genes in the four groups identified in dnmt1 mutant fish; box plots (mean; box, upper/lower quartile; whiskers, minimal/maximal values).

Expression Data

Expression Detail
Antibody Labeling
Phenotype Data

Phenotype Detail
Acknowledgments
This image is the copyrighted work of the attributed author or publisher, and ZFIN has permission only to display this image to its users. Additional permissions should be obtained from the applicable author or publisher of the image. Full text @ Commun Biol