|
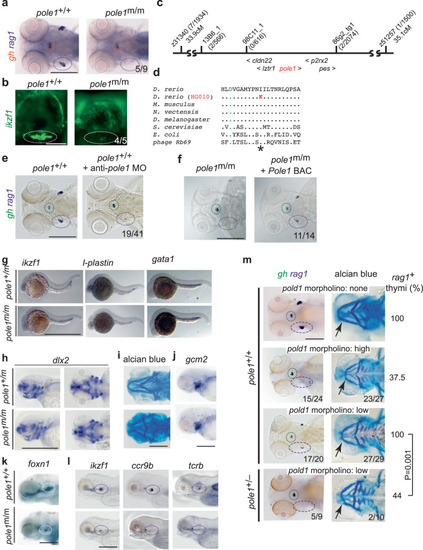
Characterization of a zebrafish pole1 hypomorphic allele. a Diagnostic whole-mount RNA in situ hybridization using rag1 (thymus; purple circle), and gh (hypophysis; orange circle) of zebrafish embryos at 5 days after fertilization (dpf) (dorsal view; representative of 9 wild-type/mutant pairs; all wild-type fish exhibit strong rag1 signals, whereas 5 mutant fish lack a rag1 signal; 4 mutant fish have weak rag1 signal; see also Fig. 9). b Thymic lymphopenia revealed by a ikzf1:EGFP reporter (lateral views; representative of 5 wild-type/mutant pairs; all wild-type fish exhibit strong signals, whereas 4 mutant fish have a minimal signal (as shown); 1 mutant fish lacks clearly discernible signal). c Genetic map for the region on chromosome 5 in the vicinity of the pole1 gene (not to scale; transcriptional orientations indicated). The number of recombination events observed between several genetic markers and the mutated locus in the number of meioses shown is indicated in brackets. d Identification of an I633K missense mutation in the pole1 gene of HG010 mutants. Partial protein sequences encompassing the region of the first of three catalytic aspartates (asterisk; orange font) and the universally conserved isoleucine (I) residue in family B DNA polymerases (red outline) are shown for several species (Genbank accession numbers): D. rerio Pole1, amino acids [aa] 623-643 (NP_001121995); M. musculus Pole1, aa 624-644 (AAD46482); N. vectensis DNA Pole, aa 610-620 (XP_001628405); D. melanogaster DNA Pole, aa 622-642 (BAB17608); S. cerevisiae POL2, aa 638-658 (CAA63235); E. coli polB, aa 417-437 (YP_851261); bacteriophage Rb69 DNA polymerase ChainA, aa 409-429 (1WAJ_A). e Phenocopy of impaired T cell development in pole morphants; in 19 embryos, the rag1 signal was specifically lost (the gh signal was unchanged), otherwise only slightly reduced or normal. f Phenotypic rescue by mouse Pole1; in 11 of 14 mutants, rag1 signals could be detected after BAC injection. g Normal embryonic haematopoiesis in pole1 mutants, as determined by whole-mount RNA in situ hybridization at 24 h after fertilization with the indicated gene-specific probes; representative of between 4 and 7 wild-type/mutant pairs. h Near normal craniofacial structures as determined by whole-mount RNA in situ hybridization with dlx2, at 3 days after fertilization (dpf) (representative of 5 wild-type/mutant pairs). i Analysis of craniofacial structures as determined by alcian blue staining to visualize cartilage structures at 4 dpf (representative of 3 wild-type/mutant pairs). j Normal shape of pharyngeal ectoderm indicated by gcm2 expression; representative of 5 wild-type/mutant pairs. k Normal pharyngeal endoderm indicated by foxn1 expression; representative of 5 wild-type/mutant pairs. l Impaired T cell differentiation indicated by expression of ikzf1, ccr9b and tcrb (representative of between 5 and 15 wild-type/mutant pairs). m Genetic interaction between pole and pold1 (representative embryos shown). First row: Uninjected wild-type (pole+/+) embryos are shown for reference. The gh signal is marked in green, the rag1 signal in the thymus in purple (whole mount RNA in situ hybridization, left panel); the arrow points to the intersection of cartilaginous structures of the ethmoid plate of the neurocranium and the mandibular arch (alcian blue staining; right panel). The fraction of embryos with rag1-positive thymi is shown in the right-hand column. Second row: Injection of high concentrations of anti-pold1 oligonucleotides (1 mM) results in the loss of rag1 signals in the majority of embryos (15/24). The mandibular arch is shorter in 23 out of 27 morphants. Third row: Injection of low concentrations of anti-pold1 oligonucleotides (0.2 mM) results in milder phenotypes; 17 out of 20 morphants had a reduced rag1 signal in the thymus; the mandibular arch was normal in 2 and somewhat smaller in 27 out of 29 morphants. Fourth row: Injection of low concentrations of anti-pold1 oligonucleotides (0.2 mM) into embryos heterozygous for the polet20320 allele caused severe phenotypes. In 5 out of 9 morphants, no rag1 signal was observed, whereas it was present but reduced in four fish; the mandibular arch was severely affected in 2 (representative embryo shown), mildly affected in 6 and normal in 2 morphants. The effect of anti-pold1 oligonucleotides on rag1 expression in wild-type versus pole+/t20320 heterozygotes is statistically significant (t- test; two-tailed). Scale bars, (a, e–m [1 mm]; b [0.25 mm]).
|