
Fig. 6
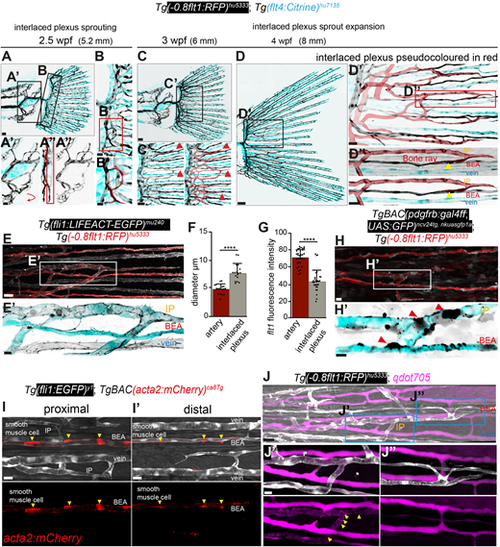
Formation of the interlaced plexus at the fin base. (A-D″) Maximum intensity projections of confocal z-stacks of Tg(-0.8flt1:RFP)hu5333; Tg(flt4: citrine)hu7135 double-transgenic fish labelling all arterial ECs (black) and venous ECs (cyan). Scale bars: 30 μm for A; 50 μm for C; 100 μm for D. (A′,A″) Proximal fin plexus. Scale bar: 20 μm. (B,B′) Initial loops of the interlaced plexus at the fin base (pseudo-coloured in red in B′). Scale bar: 10 μm for B; 5 μm for B′. (C-D″) Interlaced plexus (pseudo-coloured in red). Blunt ends (C,C′, red arrowheads) and connections with bone enclosed arteries (D-D″, yellow arrowheads). Scale bar: 10 μm for C′; 20 μm for D′; 15 μm for D″. (E,E′) Maximum intensity projections of confocal z-stacks of Tg(fli1:LIFEACT-EGFP)mu240; Tg(-0.8flt1:RFP)hu5333 double-transgenic fish labelling all arterial ECs (red/cyan) and all ECs (white/black). Scale bars: 20 μm for E; 7 μm for E′. (F) Comparison of the diameters of bone-enclosed artery (BEA) and interlaced plexus (IP). Paired t-test (****P≤0.0001; n=17 segments from three individual fish for diameter measurements of the IP and BEA; data points indicate individual segments; data are mean±s.d.). (G) Flt1 fluorescence intensity measurements. Paired t-test (****P≤0.0001; n=30 cells for IP; n=32, data points indicate intensity values of individual cells; data are mean±s.d.). (H) Maximum intensity projections of confocal z-stacks of Tg(-0.8flt1:RFP)hu5333; TgBAC(pdgfrb:gal4ff;UAS:GFP)ncv24tg, nkuasgfp1a double-transgenic fish labelling all arterial ECs (red/cyan) and mural cells (white/black) in lateral views; anterior towards the left. (H′) Mural cells on the IP and BEA (red arrowheads). Scale bars: 10 μm for H; 5 μm for H′. (I) Maximum intensity projections of confocal z-stacks of Tg(Fli1:EGFP)y1; TgBAC(acta2:mcherry)ca8Tg labelling all ECs (white) and smooth muscle cells (red). (I) Proximal area. Scale bar: 50 μm. (I′) Distal area. Scale bar: 10 μm. (J-J″) Maximum intensity projections of confocal z-stacks of Tg(-0.8flt1:RFP)hu5333; qdot705 injections labelling arterial ECs (white) and blood vessel lumina (magenta). Yellow arrowheads indicate red blood cells. Scale bar: 20 μm for J; 7 μm for J′ and J″. |