
Fig. 3
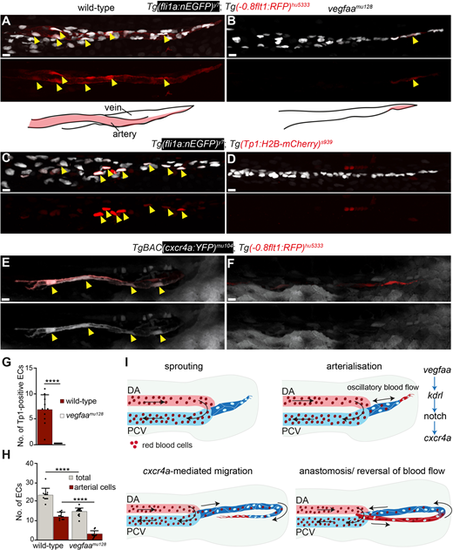
Formation of the posterior circulatory loop depends on VEGF signalling upstream of Notch signalling. (A,B) Maximum intensity projection of confocal z-stacks of Tg(fli1a:nEGFP)y7; Tg(-0.8flt1:RFP)hu5333. (A) Wild-type control. Scale bar: 10 μm. Schematic drawing indicates artery and vein. Yellow arrowheads indicate arterial ECs. (B) vegfaamu128 mutant. Schematic drawing indicates a tail blood vessel sprout lacking a discernible artery. Scale bar: 10 μm. Yellow arrowheads indicate arterial ECs. (C,D) Maximum intensity projections of confocal z-stacks of Tg(fli1a:nEGFP)y7; Tg (Tp1:H2B-mCherry)s939. (C) Wild-type control. (D) vegfaamu128 mutant. Scale bar: 10 μm. Yellow arrowheads indicate ECs with Notch pathway activation. (E,F) Maximum intensity projections of confocal z-stacks of TgBAC(cxcr4a:YFP)mu104; Tg(-0.8flt1:RFP)hu5333. (E) Wild-type control. (F) vegfaamu128 mutant. Scale bar: 10 μm. Yellow arrowheads indicate ECs expressing cxcr4a. (G) Quantification of ECs with Notch pathway activation in wild-type controls (n=10) and vegfaamu128 mutants (n=10). Unpaired t-test (****P≤0.0001). (H) Quantification of total and arterialized ECs in wild-type controls (n=11) and vegfaamu128 mutants (n=13). Unpaired t-test (****P≤0.0001). Data points indicate results from individual embryos. Data are mean±s.d. (I) Schematic representation of signalling pathways controlling vein-artery sprouting in the tail fin. |