
Fig. 1
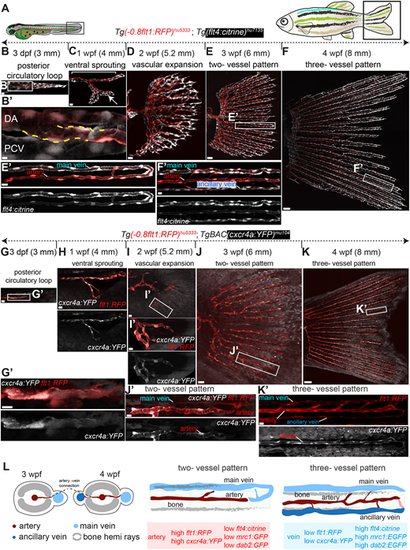
Branching morphogenesis of zebrafish caudal fin vasculature. (A) Time course of the study from 3 dpf to 4 wpf (3 mm standard length to 8 mm standard length). (B-F) Maximum intensity projections of confocal z-stacks of Tg(-0.8flt1:RFP)hu5333; Tg(flt4:citrine)hu7135 double-transgenic animals labelling arterial ECs (red) and venous ECs (white). Lengths for indicated timepoints are the average from 10 larvae. (B) Posterior circulatory loop (PCL) at 3 dpf. Scale bar: 50 μm. (B′) Area outlined in B showing anastomosis of a newly formed sprout with the dorsal aorta (DA) (yellow dashed lines). Scale bar: 20 μm. (C) First ventral sprout at 1 wpf. Bracket marks posterior axial vessels. Scale bar: 15 μm. (D) Vascular expansion at 2 wpf. Scale bar: 20 μm. (E) Alignment of arteries and veins at 3 wpf. Scale bar: 40 μm. (E′) Area outlined in E showing a two-vessel pattern (artery, main vein). Scale bar: 10 μm. (F,F′) Three-vessel pattern at 4 wpf. Scale bar: 80 μm. (F′) Area outlined in F showing caudal fin vasculature displaying a three-vessel pattern (main vein, artery and ancillary vein). Scale bar: 10 μm. (G-K) Maximum intensity projections of confocal z-stacks of Tg(-0.8flt1:RFP)hu5333; TgBAC(cxcr4a:YFP)mu104 double-transgenic animals. (G) Posterior circulatory loop (PCL) at 3 dpf (3 mm standard length). Scale bar: 10 μm. (G′) Area outlined in G showing anastomosis of a newly formed sprout with the dorsal aorta (DA). Scale bar: 5 μm. (H) Sprout extending into the fin fold at 1 wpf (4 mm standard length). Scale bar: 15 μm. (I) Expansion of the vascular tree at 2 wpf (5.2 mm standard length). Scale bar: 20 μm. (I′) Area outlined in I showing overlap of cxcr4a and flt1 expression. Scale bar: 10 μm. (J) Developing arteries at 3 wpf (6 mm standard length). Scale bar: 30 μm. (J′) Area outlined in J showing two-vessel pattern (artery and main vein). Scale bar: 8 μm. (K) 4 wpf (8 mm standard length). Scale bar: 100 μm. (K′) Area outlined in K showing three-vessel pattern (main vein, artery and ancillary vein). Scale bar: 10 μm. (L) Schematic representation of artery-vein connections and marker gene expression in the caudal fin arteries and veins. |