
Fig. 8
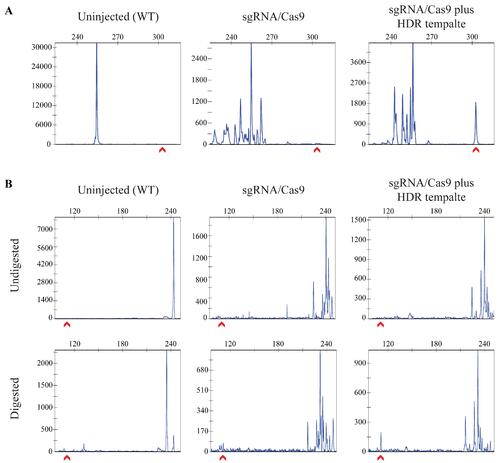
Examples of CRISPR-STAT plots from injected embryos to detect somatic knock-in. CRISPR-STAT plots from uninjected, sgRNA/Cas9-injected, and sgRNA/Cas9 plus HDR template–injected embryos are analyzed to determine if an enrichment of the peak corresponding to the knock-in allele size is seen in the presence of HDR template. The x-axis shows the size of the peaks (bp), the y-axis shows fluorescent intensity, and the red arrow denotes the expected knock-in allele. (A) Example of a DNA insertion with the knock-in peak being larger than the WT allele. (B) Example of a point mutation before and after digestion. The undigested samples serve as controls, with peak for WT allele at 7–10 bp larger than in the digested samples. The peak for knock-in allele should only be observed after digestion in sgRNA/Cas9 plus HDR template samples. |