
FIGURE
Fig. 3
Fig. 3
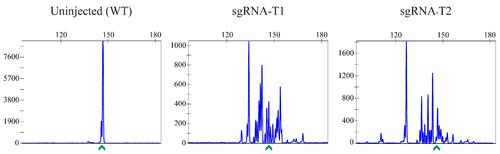
Examples of CRISPR-STAT plots showing sgRNA activity. In this example, both sgRNAs selected in Figure 1 are active. sgRNA-T1 would be selected as the best target and used in subsequent steps, as it generates the DSB closer to the intended nucleotide change. The x-axis shows the size of the peaks (bp), the y-axis shows fluorescent intensity, and the green arrow denotes the WT allele. |
Expression Data
Expression Detail
Antibody Labeling
Phenotype Data
Phenotype Detail
Acknowledgments
This image is the copyrighted work of the attributed author or publisher, and
ZFIN has permission only to display this image to its users.
Additional permissions should be obtained from the applicable author or publisher of the image.
Full text @ Bio Protoc