
FIGURE 8
- ID
- ZDB-FIG-230504-22
- Publication
- Bise et al., 2023 - The regeneration-responsive element careg monitors activation of Müller glia after MNU-induced damage of photoreceptors in the zebrafish retina
- Other Figures
- All Figure Page
- Back to All Figure Page
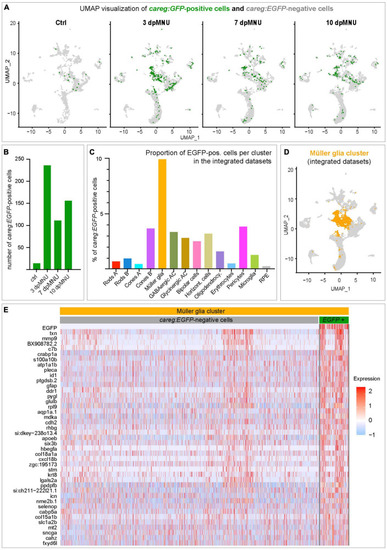
careg:EGFP is expressed in a subpopulation of Müller glia after MNU injury. (A) UMAP plots showing the distribution of careg:EGFP-positive cells (green) per condition. (B) Bar plot showing numbers of careg:EGFP-positive cells per time-point. (C) Histogram displaying the proportion of careg:EGFP-positive cells per cluster in the integrated cell RNA-sequencing data. (D) UMAP plot showing the distribution of the Müller glia cluster cells (orange) in the integrated scRNA-seq data. (E) A heatmap of differential gene expression analysis in careg:EGFP-positive cells compared to EGFP-negative cells within the Müller glia cluster. Complete data are in Supplementary Table 10. |