
Figure 3
- ID
- ZDB-FIG-230428-11
- Publication
- Frantz et al., 2023 - Pigment cell progenitor heterogeneity and reiteration of developmental signaling underlie melanocyte regeneration in zebrafish
- Other Figures
- All Figure Page
- Back to All Figure Page
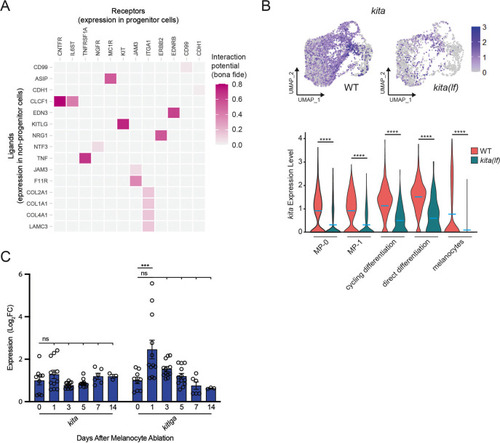
(A) Heatmap of NicheNetR-identified ligand/receptor pairs indicating interaction potential between receptors on progenitor receiver cells and ligands on non-progenitor sender cells sampled by scRNAseq. Ligand/receptor pairs were restricted to literature-supported pairs (Browaeys et al., 2020). (B) Top, feature and, bottom, violin plots of kita expression in mitfa+aox5lo cells from wild-type (MP-0 = 1840, MP-1 = 1408, cycling differentiation = 777, direct differentiation = 535, and melanocytes = 1060 cells) and kita(lf) strains (MP-0 = 617, MP-1 = 612, cycling differentiation = 280, direct differentiation = 57, and melanocytes = 563 cells). Mean gene expression represented by cyan bars. p values calculated by Wilcoxon rank-sum test, ****p < 0.0001. (C) Quantitative real-time polymerase chain reaction (qRT-PCR) of kita and kitlga expression in zebrafish skin following melanocyte destruction. Three biological replicates were performed for each time point. Data are shown as mean ± standard error of the mean (SEM). p values calculated by one-way analysis of variance (ANOVA) with Dunnett’s multiple comparisons test, ***p < 0.001; ns, not significant.
|