
Figure 6
- ID
- ZDB-FIG-230428-20
- Publication
- Frantz et al., 2023 - Pigment cell progenitor heterogeneity and reiteration of developmental signaling underlie melanocyte regeneration in zebrafish
- Other Figures
- All Figure Page
- Back to All Figure Page
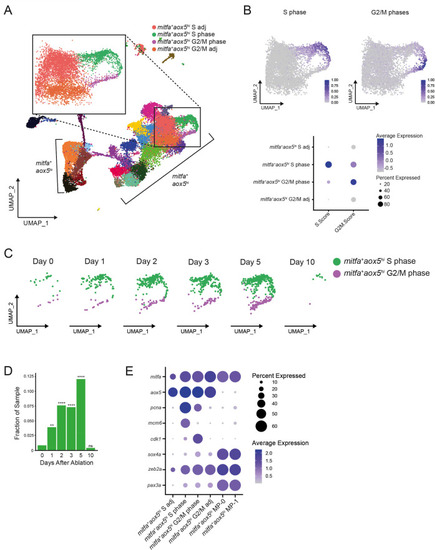
(A) UMAP of all cells sampled from wild-type animals with enlargement of cycling and adjacent subpopulations found in the large group of mitfa+aox5hi cells. (B) Top, feature and, bottom, dot plot of S phase and G2/M phase cell cycle scores of cells highlighted in (A). Cell cycle scores were calculated using Seurat’s ‘CellCycleScoring’ module and zebrafish orthologs of the cell cycle genes outlined by Tirosh et al., 2016. (C) UMAPs of cycling cells prior to and during regeneration. Biological sample runs were downsampled to a common number of total cells so shifts in clusters could be readily visualized. Cells in S phase are seen in green, and cells in G2/M phase are seen in purple. (D) Quantification of proportion of cells per scRNAseq sample in the mitfa+aox5hi cycling subpopulations (mitfa+aox5hi S phase and mitfa+aox5hi G2/M subpopulations combined) during regeneration (Day 0 = 7989, Day 1 = 4004, Day 2 = 4510, Day 3 = 5224, Day 5 = 3483, Day 10 = 4243 total cells per sample). p values calculated using differential proportion analysis (Farbehi et al., 2019), **p < 0.01; ****p < 0.0001; ns, not significant. (E) Dot plot of pigment cell and cell cycle marker genes differentially expressed across S adj, cycling, and G2/M adj mitfa+aox5hi subpopulations during melanocyte regeneration. Dot sizes represent percentage of cells in the cluster expressing the marker and coloring represents average expression.
|