
Figure 2
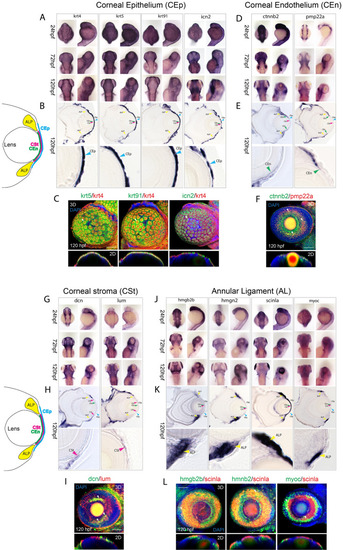
Assembly of markers for developing zebrafish corneal epithelium, endothelium, stroma and annular ligament. (A) WISH analysis of corneal epithelium markers krt4, ktr5, krt91 and icn2 expression at 24, 72 and 120 hpf displayed in dorsal and lateral views. (B) 10 µm cryosections of 120 hpf embryo eyes after WISH. C) Two color FWISH depicting co-expression of krt4(red)/krt5(green), krt91(green)/krt4(red) and icn2(green)/krt4(red) at 120 hpf. DAPI (blue) was used to stain the nuclei. Volume projections in lateral view and single section dorsal views from 3D confocal stacks are displayed. White arrows indicate example regions of co-expression. Scale bar = 100 µm. Individual fluorescence channels are provided in Fig. S1A. (D) WISH analysis of corneal endothelium markers ctnnb2 and pmp22a expression at 24, 72 and 120 hpf displayed in dorsal and lateral views. (E)10 µm cryosections of 120 hpf embryo eyes after WISH. (F) Two color FWISH depicting co-expression of pmp22a(red)/ctnnb2(green) at 120 hpf. DAPI (blue) was used to stain the nuclei. Volume projections in lateral view and single section dorsal views from 3D confocal stacks are displayed. White arrows indicate example regions of co-expression. Scale bar = 100 µm. Individual fluorescence channels are provided in Fig. S1B. (G) WISH analysis of corneal stroma markers dcn and lum expression at 24, 72 and 120 hpf displayed in dorsal and lateral views. (H)10 µm cryosections of 120 hpf embryo eyes after WISH. (I) Two color FWISH depicting co-expression of lum(red)/dcn(green) at 120 hpf. DAPI (blue) was used to stain the nuclei. Volume projections in lateral view and single section dorsal views from 3D confocal stacks are displayed. White arrows indicate example regions of co-expression. Scale bar = 100 µm. Individual fluorescence channels are provided in Fig. S1C. (J) WISH analysis of annular ligament markers hmgb2b, hmgn2, scinla and myoc expression at 24, 72 and 120 hpf displayed in dorsal and lateral views. K)10 µm cryosections of 120 hpf embryo eyes after WISH. (L) Two color FWISH depicting co-expression of hmgb2b(green)/scinla(red), hmnb2(green)/scinla(red) and myoc(green)/scinla(red) at 120 hpf. DAPI (blue) was used to stain the nuclei. Volume projections in lateral view and single section dorsal views from 3D confocal stacks are displayed. White arrows indicate example regions of co-expression. ALP Annular ligament progenitor (yellow arrow), CEp Corneal epithelium (blue arrow), CEn Corneal endothelium (green arrow), CSt Corneal stroma (green arrow). Scale bar = 100 µm. Individual fluorescence channels are provided in Fig. S1D. |
| Genes: | |
|---|---|
| Fish: | |
| Anatomical Terms: | |
| Stage Range: | Prim-5 to Day 5 |