
Fig. 6
- ID
- ZDB-FIG-230312-44
- Publication
- Zeng et al., 2022 - Hypoxia-Responsive Subtype Cells Differentiate Into Neurons in the Brain of Zebrafish Embryos Exposed to Hypoxic Stress
- Other Figures
- All Figure Page
- Back to All Figure Page
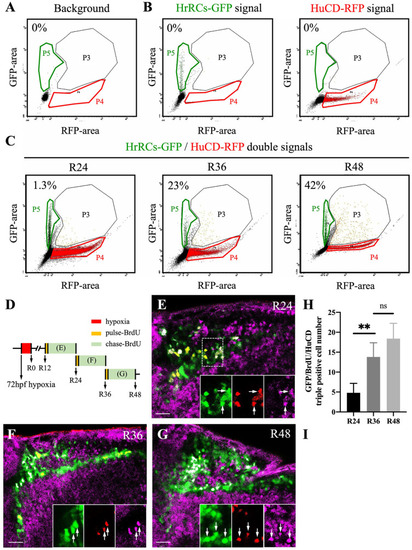
HrRCs can differentiate into neurons in vivo. Brain samples were obtained from nontreated huORFZ and hypoxia-exposed huORFZ embryos during recovery time and then subjected to cell suspension, followed by flow cytometry and immunostaining with HuC/HuD antibody. (A) To serve as background control, a single-cell fraction was obtained after suspending the brain of nontreated embryos. (B) Cells expressing GFP signal were located at P5 gate (green color gate). After immunostaining, Sox2 cells labeled with red were located at P4 gate (red color gate). Cells coexpressing green and red signals were located at P3 gate (black color gate). (C) After suspending the brain cells of hypoxia-exposed huORFZ embryos during recovery at R24, R36, and R48, cells expressing green, red, and coexpressing green and red signals were located at P5, P4, and P3 gates, respectively. The number shown in the upper left corner of each panel represents the percentage of neurons differentiated from HrRCs among total examined HrRCs. (D) Experimental design to depict the pulse-chase BrdU of HrRCs to determine if proliferative HrRCs could directly differentiate into neurons. (E–G) Immunostaining patterns against BrdU for hypoxia-exposure huORFZ embryos. Pulse BrdU: huORFZ embryos were incubated with BrdU for 20 min. Chase BrdU: embryos were incubated in medium without BrdU for 12 h. Embryos were collected and observed at R24, R36, and R48. BrdU-labeled cells were the proliferated cells. (H) Calculating the percentages of GFP/BrdU-red/HuCD-pink overlapped signals among HrRCs at R24, R36, and R48 (two-way ANOVA with multiple comparisons test, **P < 0.01; t test: **P < 0.01), while there was no significant difference between R36 and R48 groups. Error bars indicated SEM. (I) Calculating the percentages of HuCD-expressing HrRCs at R24, R36, and R48 by FACS. The scale bar is 10 μm. HrRCs: hypoxia-responsive recovering cells; BrdU: 5-bromo-2′-deoxyuridine; FACS: fluorescence-activated cell sorting; n.s.: not significant; SEM: standard error of the mean; ANOVA: analysis of variance. |