
Fig. 5
- ID
- ZDB-FIG-230312-43
- Publication
- Zeng et al., 2022 - Hypoxia-Responsive Subtype Cells Differentiate Into Neurons in the Brain of Zebrafish Embryos Exposed to Hypoxic Stress
- Other Figures
- All Figure Page
- Back to All Figure Page
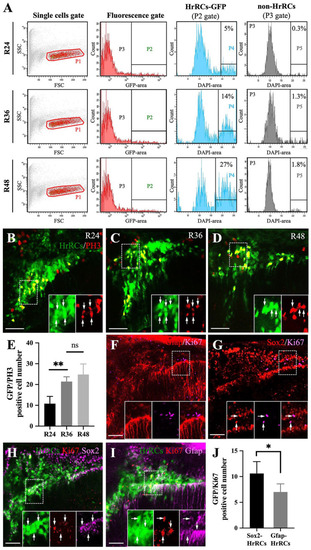
Using an in vivo system to demonstrate that GFP-expressing HrRCs could proliferate. The heads of hypoxia-exposed huORFZ embryos during recovery time, as indicated, were collected, subjected to cell suspension, and then FACS sorting combined with immunostaining. (A) Scatter profiles of brain cells obtained from treated huORFZ embryos. Single-cell fraction was gated (red gate; P1). Cells expressing GFP, such as GFP-expressing HrRCs, were located at P2 gate, while cells not expressing GFP, such as non-HrRCs, were located at P3 gate. After selecting P2 and P3 gates, single cells were gated based on the DAPI-area signal. Cell cycle analysis was calculated G2 m from a DAPI-area histogram shown on P4 and P5 gates which were calculated from P2 and P3 gates, respectively. The number shown in the right corner represents the percentage of the number of proliferated cells among the total examined cells. (B–D) Hypoxia-exposure huORFZ embryos were stained for M phase marker (PH3, red) at R24, R36, and R48. The lower right three panels were amplified from the area indicated by the box, and the arrows indicated that the HrRCs could express the PH3-red signal. (E) The average number of HrRCs, both GFP-positive HrRCs and PH3-positive cells per embryos (n = 5), was calculated and graphed with error bars (two-way ANOVA with multiple comparisons test, **P < 0.01; t test: **P < 0.01). Error bars indicate SEM. (F–G) Zebrafish embryos were stained for proliferation marker (Ki67, red) together with (F) NSPCs (Sox2, pink) and (G) RGs (Gfap, pink) in the normoxic huORFZ embryos at 98 hpf. The lower right three panels were amplified from the area indicated by the box, and the arrows indicated that HrRCs could coexpress Ki67-red, together with either NSPCs (Sox2, pink) or RGs (Gfap, pink) signal. (H–I) Zebrafish embryos were stained for markers of (H) Sox2 and (I) Gfap combined with proliferate marker (Ki67, red) in the hypoxic huORFZ embryos at R48. The lower right three panels were amplified from the area indicated by box, and the arrow indicated the NSPCs-HrRCs and RGs-HrRCs subtypes’ cell population could coexpress Ki67-red signal. (J) The number of NSPCs-HrRCs and RGs-HrRCs that were also PH3-positive in an embryo was calculated and graphed with error bars. Data were averaged from five embryos. The unpaired t test showed the different degree between proliferated-NSPCs-HrRCs and proliferated-RGs-HrRCs subtype cells (Statistical analysis was based on t test at *P < 0.05 significance). Error bars indicate SEM. The scale bar in (B–C) and (F–I) represents 20 and 15 µm, respectively. HrRCs: hypoxia-responsive recovering cells; FACS: fluorescence-activated cell sorting; DAPI: 4′,6-diamidino-2-phenylindole; NSPCs: neural stem/progenitor cells; RGs: radial glia cells; hpf: hours postfertilization; n.s.: not significant; SEM: standard error of the mean; ANOVA: analysis of variance. |