
Fig. 4
- ID
- ZDB-FIG-230312-42
- Publication
- Zeng et al., 2022 - Hypoxia-Responsive Subtype Cells Differentiate Into Neurons in the Brain of Zebrafish Embryos Exposed to Hypoxic Stress
- Other Figures
- All Figure Page
- Back to All Figure Page
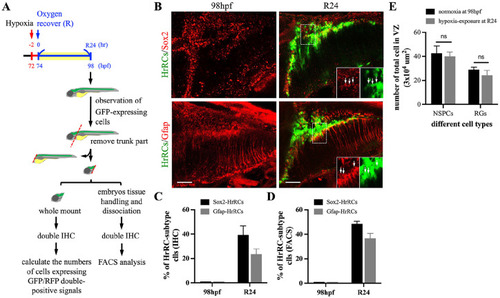
The HrRC population mostly comprised neural stem/progenitor cells and radial glia cells. (A) Schematic illustration of experimental workflow. Zebrafish embryos from transgenic line huORFZ developed at 72 hpf, 2 h prior to oxygen recovery (R-2), were exposed to hypoxia for 2 h, followed by the start of oxygen recovery (R0, 74 hpf). The heads of huORFZ embryos at R24 were collected. Immunostaining for FACS sorting was performed and the number of specific cell types calculated. To distinguish NSPCs among all HrRCs, antiserum against SRY (sex determining region Y)-box 2 (Sox2) labeled with red fluorescent signal was used. Subtype markers of (B) RGs (Gfap, red) and NSPCs (Sox2, red) that colocalized with HrRCs (green) were indicated by yellow signals. The lower right three panels were amplified from the area indicated by the box. Arrows indicated that GFP-expressing HrRCs were coexpressed with either RG (Gfap, pink) or NSPC (Sox2, pink) signal. (C) The ratio of HrRCs with either Sox2- or Gfap-expressing in the normoxic huORFZ embryos at 98 hpf and hypoxia-exposure huORFZ embryos at R24 were counted. The diagram exhibited the percentages of NSPC and RG subtypes displaying yellow color among total GFP-expressing HrRCs. Data were averaged from counting five embryos at the same position of brain. (D) Calculating the ratio of two cell types among GFP-expressing cell populations isolated by FACS. Error bars indicate SEM. The scale bar is 20 µm. (E) Calculating the number of NSPCs and RGs among total examined cells in the VZ (area was 3 × 104 μm2). HrRCs: hypoxia-responsive recovering cells; hpf: hours postfertilization; FACS: fluorescence-activated cell sorting; NSPCs: neural stem/progenitor cells; RGs: radial glia cells; VZ: ventricular zone; n.s.: no significant difference; SEM: standard error of the mean. |