
- Title
-
Hypoxia-Responsive Subtype Cells Differentiate Into Neurons in the Brain of Zebrafish Embryos Exposed to Hypoxic Stress
- Authors
- Zeng, C.W., Sheu, J.C., Tsai, H.J.
- Source
- Full text @ Cell Transplant
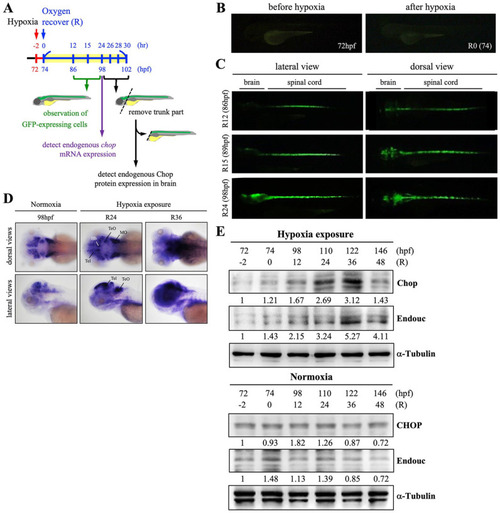
Expression of exogenous GFP and endogenous chop transcripts and the appearance of HrRCs in the brain of hypoxia-exposed huORFZ embryos. (A) Schematic illustration of experimental workflow. Zebrafish embryos from transgenic line huORFZ developed at 72 hpf, 2 h prior to oxygen recovery (R-2), were exposed to hypoxia for 2 h, followed by the start of oxygen recovery (R0, 74 hpf). (B) No GFP signal was presented in the huORFZ embryos served as mock control groups at 72 hpf and R0 (74 hpf). (C) The GFP signal started to appear in embryos undergoing oxygen recovery for 12 h (R12), while GFP was observed in the brain at R15. (D) Dorsal and lateral views of the temporospatial expression of chop transcript in the nonhypoxia-exposure huORFZ (normoxia; positive control group) embryos at 98 hpf (equivalent to R24) and hypoxia-exposure huORFZ embryos at R24 (equivalent to 98 hpf) and R36 (equivalent to 110 hpf) using whole-mount in situ hybridization (WISH). The chop mRNA was mainly expressed in the telencephalon (Tel), habenula (Hb), optic tectum (TeO), ventricular zone (VZ), and medulla oblongata (MO). Western blot analyses of (E) CHOP and Endouc proteins presented at various stages of normoxia- and hypoxia-exposure huORFZ embryos. Total proteins were extracted from the heads of embryos at the start of recovery (74 hpf; R0) through 146 hpf (R72), as indicated. The control group consisted of untreated huORFZ embryos (normoxia) after extraction of total proteins from the head at the corresponding hpf of treated embryos. α-Tubulin served as a loading control. HrRCs: hypoxia-responsive recovering cells; hpf: hours postfertilization. |
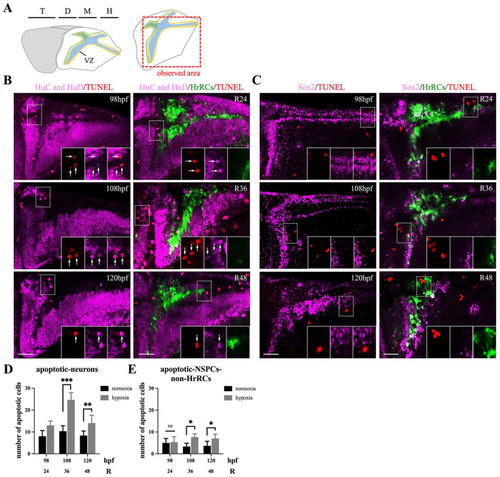
HrRCs in the brain of hypoxia-exposed huORFZ embryos did not undergo apoptosis during oxygen recovery. TUNEL staining as a quantitative assay was performed to determine the hypoxia-induced zebrafish embryos apoptosis. (A) Schematic representation of the embryonic brain (72 hpf), showing the forebrain (in yellow), midbrain (m), and hindbrain (h). Forebrain is subdivided in the telencephalon (t) and the diencephalon (d). The red dotted line box indicated the observation area. Apoptotic cells were marked by red after TUNEL staining with (B) early neuron marker, HuC/HuD, and (C) NSPC marker, Sox2, were observed under a fluorescent confocal microscopy in the normoxic huORFZ embryos at 98, 108, and 120 hpf (equivalent to R24, R36, and R48, respectively) and hypoxic huORFZ embryos at R24, R36, and R48 (equivalent to 98, 108, and 120 hpf, respectively). Each figure in the lower right three panels was amplified from the area indicated by the dotted line box. Arrow indicated that the cells expressed red-colored TUNEL signals. Quantitative analyses of (D) apoptotic early neurons (HuC/HuD marker) and (E) apoptotic NSPCs-non-HrRCs (Sox2 marker) by TUNEL assay. Black and gray bars indicated the normoxic and hypoxic huORFZ embryos, respectively. Data were averaged from five examined embryos at the same position of brain. The unpaired t test showed the significant difference of apoptotic cells between two studied groups (Statistical analysis was based on t test at **P < 0.05, ***P < 0.001 significance). Error bar indicates SEM. The scale bar is 40 μm. HrRCs: hypoxia-responsive recovering cells; TUNEL: terminal deoxynucleotidyl transferase dUTP nick-end labeling; hpf: hours postfertilization; NSPCs: neural stem/progenitor cells; VZ: ventricular zone; SEM: standard error of the mean; HuC and HuD: Neural Hu proteins. |
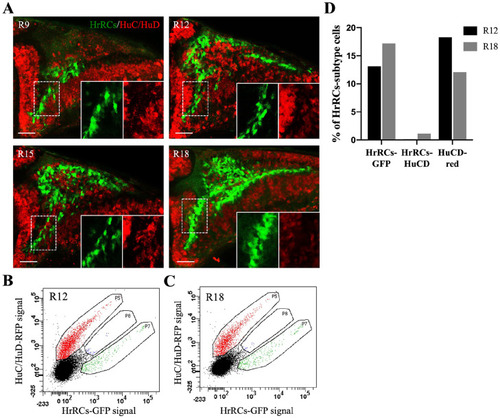
HrRCs in the brain did not express the early neuronal marker HuC/HuD. The images of fluorescence confocal microscopy were obtained from the hypoxia-exposure huORFZ embryos during recovery at different stages. (A) GFP-expressing HrRCs were observed under fluorescence microscopy at R9, R12, R15, and R18. The lower right two panels were amplified from the area indicated by the white dotted line box. (B–C) Data displayed the percentage of red-labeled HuC/HuD neurons overlapped with GFP-expressing HrRCs (at P8 gate) at R12 and R18 obtained through FACS sorting and immunostaining. (D) Calculation of the percentages of three different subtype cell populations isolated by FACS at R12 and R18. The scale bar is 20 µm. HrRCs: hypoxia-responsive recovering cells; FACS: fluorescence-activated cell sorting. |
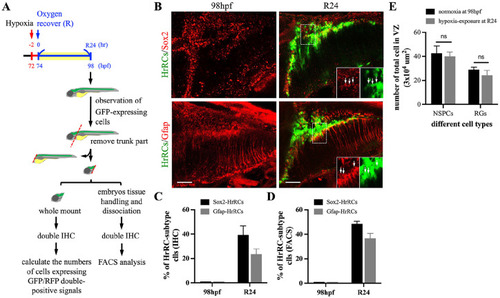
The HrRC population mostly comprised neural stem/progenitor cells and radial glia cells. (A) Schematic illustration of experimental workflow. Zebrafish embryos from transgenic line huORFZ developed at 72 hpf, 2 h prior to oxygen recovery (R-2), were exposed to hypoxia for 2 h, followed by the start of oxygen recovery (R0, 74 hpf). The heads of huORFZ embryos at R24 were collected. Immunostaining for FACS sorting was performed and the number of specific cell types calculated. To distinguish NSPCs among all HrRCs, antiserum against SRY (sex determining region Y)-box 2 (Sox2) labeled with red fluorescent signal was used. Subtype markers of (B) RGs (Gfap, red) and NSPCs (Sox2, red) that colocalized with HrRCs (green) were indicated by yellow signals. The lower right three panels were amplified from the area indicated by the box. Arrows indicated that GFP-expressing HrRCs were coexpressed with either RG (Gfap, pink) or NSPC (Sox2, pink) signal. (C) The ratio of HrRCs with either Sox2- or Gfap-expressing in the normoxic huORFZ embryos at 98 hpf and hypoxia-exposure huORFZ embryos at R24 were counted. The diagram exhibited the percentages of NSPC and RG subtypes displaying yellow color among total GFP-expressing HrRCs. Data were averaged from counting five embryos at the same position of brain. (D) Calculating the ratio of two cell types among GFP-expressing cell populations isolated by FACS. Error bars indicate SEM. The scale bar is 20 µm. (E) Calculating the number of NSPCs and RGs among total examined cells in the VZ (area was 3 × 104 μm2). HrRCs: hypoxia-responsive recovering cells; hpf: hours postfertilization; FACS: fluorescence-activated cell sorting; NSPCs: neural stem/progenitor cells; RGs: radial glia cells; VZ: ventricular zone; n.s.: no significant difference; SEM: standard error of the mean. |
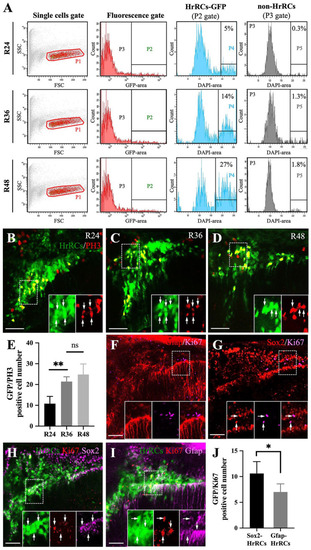
Using an in vivo system to demonstrate that GFP-expressing HrRCs could proliferate. The heads of hypoxia-exposed huORFZ embryos during recovery time, as indicated, were collected, subjected to cell suspension, and then FACS sorting combined with immunostaining. (A) Scatter profiles of brain cells obtained from treated huORFZ embryos. Single-cell fraction was gated (red gate; P1). Cells expressing GFP, such as GFP-expressing HrRCs, were located at P2 gate, while cells not expressing GFP, such as non-HrRCs, were located at P3 gate. After selecting P2 and P3 gates, single cells were gated based on the DAPI-area signal. Cell cycle analysis was calculated G2 m from a DAPI-area histogram shown on P4 and P5 gates which were calculated from P2 and P3 gates, respectively. The number shown in the right corner represents the percentage of the number of proliferated cells among the total examined cells. (B–D) Hypoxia-exposure huORFZ embryos were stained for M phase marker (PH3, red) at R24, R36, and R48. The lower right three panels were amplified from the area indicated by the box, and the arrows indicated that the HrRCs could express the PH3-red signal. (E) The average number of HrRCs, both GFP-positive HrRCs and PH3-positive cells per embryos (n = 5), was calculated and graphed with error bars (two-way ANOVA with multiple comparisons test, **P < 0.01; t test: **P < 0.01). Error bars indicate SEM. (F–G) Zebrafish embryos were stained for proliferation marker (Ki67, red) together with (F) NSPCs (Sox2, pink) and (G) RGs (Gfap, pink) in the normoxic huORFZ embryos at 98 hpf. The lower right three panels were amplified from the area indicated by the box, and the arrows indicated that HrRCs could coexpress Ki67-red, together with either NSPCs (Sox2, pink) or RGs (Gfap, pink) signal. (H–I) Zebrafish embryos were stained for markers of (H) Sox2 and (I) Gfap combined with proliferate marker (Ki67, red) in the hypoxic huORFZ embryos at R48. The lower right three panels were amplified from the area indicated by box, and the arrow indicated the NSPCs-HrRCs and RGs-HrRCs subtypes’ cell population could coexpress Ki67-red signal. (J) The number of NSPCs-HrRCs and RGs-HrRCs that were also PH3-positive in an embryo was calculated and graphed with error bars. Data were averaged from five embryos. The unpaired t test showed the different degree between proliferated-NSPCs-HrRCs and proliferated-RGs-HrRCs subtype cells (Statistical analysis was based on t test at *P < 0.05 significance). Error bars indicate SEM. The scale bar in (B–C) and (F–I) represents 20 and 15 µm, respectively. HrRCs: hypoxia-responsive recovering cells; FACS: fluorescence-activated cell sorting; DAPI: 4′,6-diamidino-2-phenylindole; NSPCs: neural stem/progenitor cells; RGs: radial glia cells; hpf: hours postfertilization; n.s.: not significant; SEM: standard error of the mean; ANOVA: analysis of variance. |
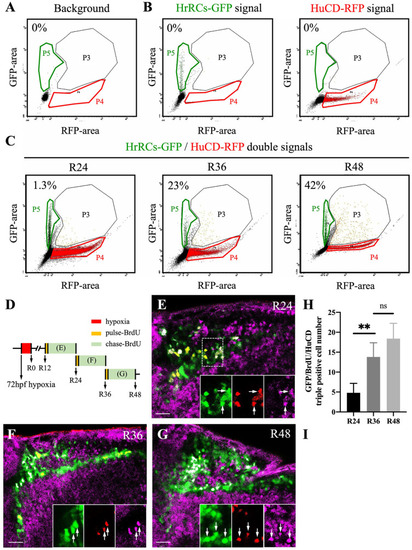
HrRCs can differentiate into neurons in vivo. Brain samples were obtained from nontreated huORFZ and hypoxia-exposed huORFZ embryos during recovery time and then subjected to cell suspension, followed by flow cytometry and immunostaining with HuC/HuD antibody. (A) To serve as background control, a single-cell fraction was obtained after suspending the brain of nontreated embryos. (B) Cells expressing GFP signal were located at P5 gate (green color gate). After immunostaining, Sox2 cells labeled with red were located at P4 gate (red color gate). Cells coexpressing green and red signals were located at P3 gate (black color gate). (C) After suspending the brain cells of hypoxia-exposed huORFZ embryos during recovery at R24, R36, and R48, cells expressing green, red, and coexpressing green and red signals were located at P5, P4, and P3 gates, respectively. The number shown in the upper left corner of each panel represents the percentage of neurons differentiated from HrRCs among total examined HrRCs. (D) Experimental design to depict the pulse-chase BrdU of HrRCs to determine if proliferative HrRCs could directly differentiate into neurons. (E–G) Immunostaining patterns against BrdU for hypoxia-exposure huORFZ embryos. Pulse BrdU: huORFZ embryos were incubated with BrdU for 20 min. Chase BrdU: embryos were incubated in medium without BrdU for 12 h. Embryos were collected and observed at R24, R36, and R48. BrdU-labeled cells were the proliferated cells. (H) Calculating the percentages of GFP/BrdU-red/HuCD-pink overlapped signals among HrRCs at R24, R36, and R48 (two-way ANOVA with multiple comparisons test, **P < 0.01; t test: **P < 0.01), while there was no significant difference between R36 and R48 groups. Error bars indicated SEM. (I) Calculating the percentages of HuCD-expressing HrRCs at R24, R36, and R48 by FACS. The scale bar is 10 μm. HrRCs: hypoxia-responsive recovering cells; BrdU: 5-bromo-2′-deoxyuridine; FACS: fluorescence-activated cell sorting; n.s.: not significant; SEM: standard error of the mean; ANOVA: analysis of variance. |
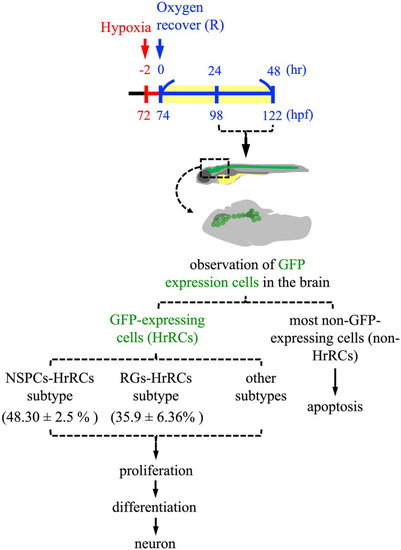
Cell fate of NSPC subtype cells which are highly sensitive to hypoxia stress in the brain of hypoxia-exposed zebrafish embryos during oxygen recovery. The embryos developed at 72 hpf from zebrafish transgenic line huORFZ were exposure to hypoxia for 2 h, followed by recovery with oxygen for 9 h (R9) to R48. During oxygen recovery within 48 h, the GFP-expressing cells [GFP(+)], which are cells highly sensitive to hypoxia, termed as HrRCs, are found in the brain at R9. Brain HrRCs are mostly composed of NSPCs and RGs. While most negative GFP-expressing cells [GFP(−)] are apoptotic during recovery from stress, GFP-expressing HrRCs are not. Instead, some HrRCs, such as a group of NSPC subtype cells (NSPCs-HrRCs subtype) and RG subtype cells (RGs-HrRCs subtype), could undergo proliferation and differentiation into neurons during regeneration. NSPCs: neural stem/progenitor cells; hpf: hours postfertilization; HrRCs: hypoxia-responsive recovering cells; RGs: radial glia cells. |