
Figure 5
- ID
- ZDB-FIG-230211-71
- Publication
- Angueyra et al., 2023 - Transcription factors underlying photoreceptor diversity
- Other Figures
- All Figure Page
- Back to All Figure Page
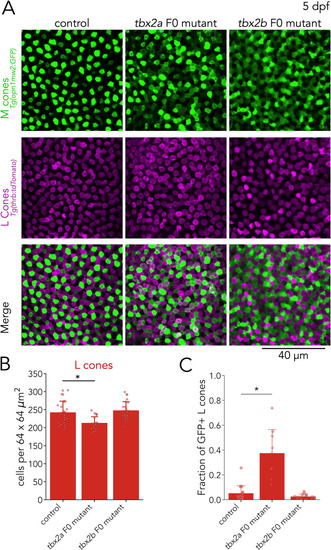
(A) Representative confocal images of the central retina of control, tbx2a and tbx2b F0 mutants at 5 dpf, in double transgenic larvae that label M cones — or M-opsin expressing cells — with GFP (green) and L cones with tdTomato (magenta). Both tbx2a and tbx2b F0 mutants display an increase in GFP-positive cells. In tbx2a F0 mutants, increase in GFP signal is restricted to tdTomato-positive cells which appear as double-positive (white) in merged images, while in tbx2b F0 mutants, increase in GFP signal is excluded from tdTomato-positive cells, producing a decrease in the space without fluorescence. (B) Compared to controls, tbx2a F0 mutants have a significant decrease in L cones (12.12% for tbx2a, Kruskal-Wallis H=18.264, p=1.08 × 10⁻⁴, nwt = 25, ntbx2a=21, ntbx2b=24; Conover-Iman posthoc corrected p-values: control vs. tbx2a P=1.21 × 10⁻³, control vs. tbx2b p=0.88, tbx2a vs. tbx2b p=3.98 × 10⁻⁵) (C) Quantification of the fraction of GFP-positive L cones (double positive cells in A) reveals a significant increase only in tbx2a F0 mutants (Kruskal-Wallis H=20.821, p=3.01 × 10⁻⁵, nwt = 18, ntbx2a=9, ntbx2b=17; Conover-Iman posthoc corrected p-values: control vs. tbx2a p=2.87 × 10⁻⁵, control vs. tbx2b p=0.63, tbx2a vs. tbx2b p=1.13 × 10⁻⁶).
|