
Figure 1
- ID
- ZDB-FIG-230211-53
- Publication
- Angueyra et al., 2023 - Transcription factors underlying photoreceptor diversity
- Other Figures
- All Figure Page
- Back to All Figure Page
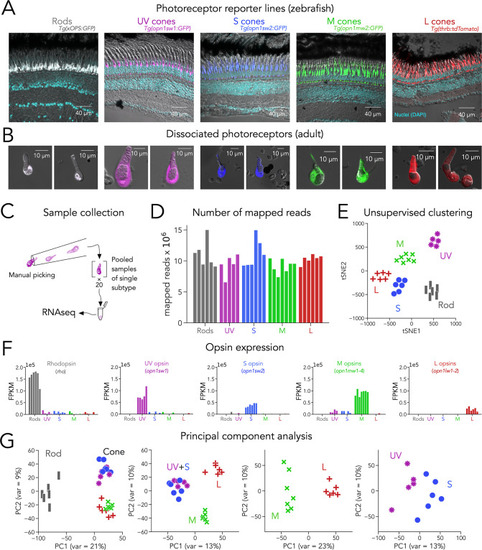
(A) Confocal images of fixed adult zebrafish retinal cross-sections, from transgenic reporter lines used to identify photoreceptor subtypes. Reporter expression is exclusive to the outer retina, and each line labels a single photoreceptor subtype with unique morphology, including rods (grey), UV cones (magenta), S cones (blue), M cones (green), and L cones (red). The inner retinal layers can be distinguished in the overlayed nuclear stain (DAPI, cyan) and transmitted DIC image (grey). (B) Confocal images of dissociated and live photoreceptors of each subtype, identified by fluorescent reporter expression. Photoreceptors have preserved outer segments and identifiable mitochondrial bundles. (C) Sample collection method. After dissociation, 20 healthy photoreceptors of a single subtype were identified by fluorescence and manually picked with a glass micropipette and pooled as a single RNA-seq sample. (D) High transcriptome depth shown by the number of reads successfully mapped to the zebrafish genome (GRCz11); bars represent individual RNA-seq samples. (E) Clustering using t-distributed stochastic neighbor embedding (tSNE) correctly separates samples by their original subtype; symbols represent individual RNA-seq samples. (F) Plots of opsin expression show high counts for the appropriate opsin in each sample (in fragments per kilobase per million reds or FPKM) and low-to-negligible counts of other opsins. For M-opsin quantification, we calculated the sum of counts for opn1mw1, opn1mw2, opn1mw3 and opn1mw4 and for L-opsin quantification, we summed counts for opn1lw1 and opn1lw2. (G) Iterative principal component analysis (PCA) shows that differences in gene expression separate rods and cones (first panel), and UV/S cones from M/L cones (second panel). M and L cones can also be distinguished by a single principal component (third panel), while separation of UV and S cones is more difficult (fourth panel).
|