
- Title
-
Transcription factors underlying photoreceptor diversity
- Authors
- Angueyra, J.M., Kunze, V.P., Patak, L.K., Kim, H., Kindt, K., Li, W.
- Source
- Full text @ Elife
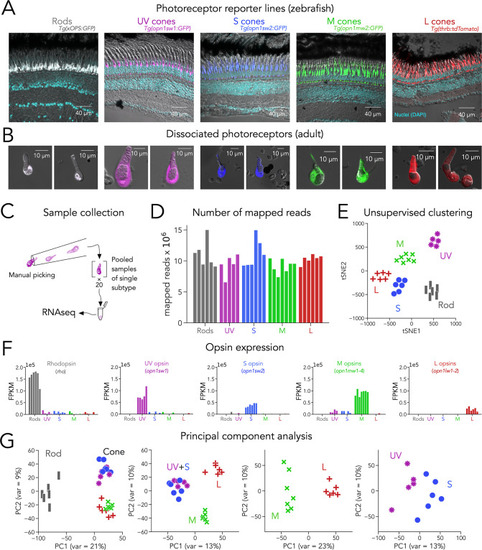
(A) Confocal images of fixed adult zebrafish retinal cross-sections, from transgenic reporter lines used to identify photoreceptor subtypes. Reporter expression is exclusive to the outer retina, and each line labels a single photoreceptor subtype with unique morphology, including rods (grey), UV cones (magenta), S cones (blue), M cones (green), and L cones (red). The inner retinal layers can be distinguished in the overlayed nuclear stain (DAPI, cyan) and transmitted DIC image (grey). (B) Confocal images of dissociated and live photoreceptors of each subtype, identified by fluorescent reporter expression. Photoreceptors have preserved outer segments and identifiable mitochondrial bundles. (C) Sample collection method. After dissociation, 20 healthy photoreceptors of a single subtype were identified by fluorescence and manually picked with a glass micropipette and pooled as a single RNA-seq sample. (D) High transcriptome depth shown by the number of reads successfully mapped to the zebrafish genome (GRCz11); bars represent individual RNA-seq samples. (E) Clustering using t-distributed stochastic neighbor embedding (tSNE) correctly separates samples by their original subtype; symbols represent individual RNA-seq samples. (F) Plots of opsin expression show high counts for the appropriate opsin in each sample (in fragments per kilobase per million reds or FPKM) and low-to-negligible counts of other opsins. For M-opsin quantification, we calculated the sum of counts for opn1mw1, opn1mw2, opn1mw3 and opn1mw4 and for L-opsin quantification, we summed counts for opn1lw1 and opn1lw2. (G) Iterative principal component analysis (PCA) shows that differences in gene expression separate rods and cones (first panel), and UV/S cones from M/L cones (second panel). M and L cones can also be distinguished by a single principal component (third panel), while separation of UV and S cones is more difficult (fourth panel).
|
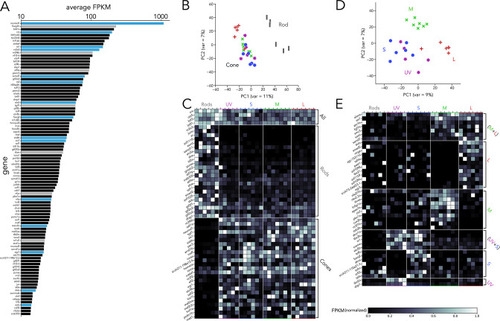
(A) Top 100 transcription factors ranked by average expression across all samples, displayed on a logarithmic scale. Genes highlighted in blue are known to be critical in photoreceptor progenitors or during photoreceptor development. Some limited information about function in photoreceptors exists for genes highlighted in grey. (B) Principal component analysis (PCA) of transcription factor expression shows that differences between rods and cones are the main source of variance. (C) Heatmap showing differential expression of transcription factors between rods and cones and divided into three groups: consistently expressed by all photoreceptors, enriched in rod samples, and enriched in cones samples. Grey values indicate expression level normalized by the maximal value in each row. Rod- and cone-enriched genes have been arranged by degree of enrichment. (D) PCA of cone samples shows that the largest differences in expression separate L cones (PC1) and M cones (PC2), while separation of UV and S cones is more difficult. (E) Heatmap of transcription factors differentially expressed in cone subtypes, divided into six relevant groups. Full list of differentially expressed transcription factors available in Supplementary file 2, Supplementary file 3.
|
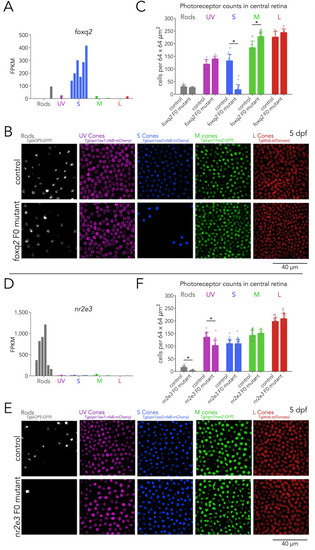
(A) Expression of foxq2 shows clear S-cone specificity. (B) Mutations in foxq2 cause a loss of S cones. Representative confocal images of the central retina of control (top row) and foxq2 F0 mutant (bottom row) larvae at 5 dpf. Each column corresponds to a transgenic line that labels a unique photoreceptor subtype, pseudo-colored according to photoreceptor subtype. (C) Quantification of photoreceptors in control and foxq2 F0 mutant larvae. Bars represent averages, error bars correspond to standard deviations, and markers correspond to individual retinas. There is a significant ~86% reduction in S cones in foxq2 F0 mutants compared to wildtype (wt) controls (Kruskal-Wallis H=22.93, p=1.6.×10–6,, nwt = 14, nfoxq2=18) and a smaller but significant ~24% increase in the density of M cones (Kruskal-Wallis H=17.55, p=2.8.×10–5, nwt = 13, nfoxq2=28). We found no significant differences in the densities of rods (Kruskal-Wallis H=0.784, p=0.376, nwt = 9, nfoxq2=6), UV cones (Kruskal-Wallis H=3.562, p=0.059, nwt = 9, nfoxq2=6), or L cones (Kruskal-Wallis H=2.267, p=0.132, nwt = 7, nfoxq2=8). (D) Expression of nr2e3 shows enrichment in rods. (E) Mutations in nr2e3 cause a loss of rods. Representative confocal images of the central retina of control (top row) and nr2e3 F0 mutant (bottom row) larvae at 5 dpf. (F) Quantification of photoreceptors in control and nr2e3 F0 mutant larvae. Bars represent averages, error bars correspond to standard deviations, and markers correspond to individual retinas. There is a significant ~80% reduction in rods in nr2e3 F0 mutants compared to controls (Kruskal-Wallis H=26.987, p=2.0 × 10⁻⁷, nwt = 19, nnr2e3=19), a smaller but significant ~25% reduction in UV cones (Kruskal-Wallis H=18.77, p=1.5 × 10⁻⁵, nwt = 24, nnr2e3=24). We found no significant differences in the densities of S cones (Kruskal-Wallis H=0.024, p=0.87, nwt = 30, nnr2e3=32), M cones (Kruskal-Wallis H=1.61, p=0.205, nwt = 30, nnr2e3=12), or L cones (Kruskal-Wallis H=2.407, p=0.12, nwt = 24, nnr2e3=22).
|
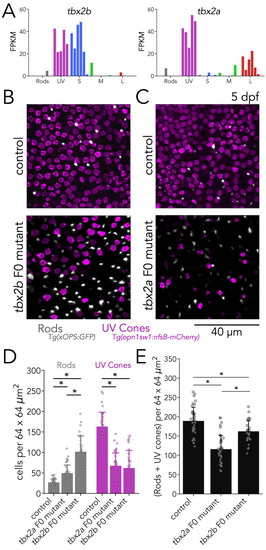
(A) tbx2b is expressed by UV and S cones (left), while tbx2a is expressed by UV and L cones (right). (B) Mutations in tbx2b cause a loss of UV cones and an increase in rods. Representative confocal images of the central retina of control and tbx2b F0 mutants at 5 dpf, in double transgenic larvae with labeled UV cones (magenta) and rods (grey). (C) Mutations in tbx2a also cause a loss of UV cones and an increase in rods. Representative confocal images of the central retina of control and tbx2a F0 mutants at 5 dpf, in the same double transgenic lines. (D) Quantification of rods and UV cones in control, tbx2a and tbx2b F0 mutant larvae. Bars represent averages, error bars correspond to standard deviations, and markers correspond to individual retinas. Compared to controls, both tbx2 F0 mutants have a significant increase in rods (1.86-fold for tbx2a and 3.86-fold for tbx2b, Kruskal-Wallis H=71.725, p=2.67 × 10⁻¹⁶, nwt = 40, ntbx2a=40, ntbx2b=30; Conover-Iman posthoc corrected p-values: control vs. tbx2a p=2.96 × 10⁻¹¹, control vs. tbx2b p=4.16 × 10⁻²⁶) but this increase significantly smaller in tbx2a F0 mutants (tbx2a vs. tbx2b p=2.25 × 10⁻¹⁰); both tbx2 F0 mutants have a marked decrease in UV cones (58.91% for tbx2a and 62.32% for tbx2b, Kruskal-Wallis H=66.907, p=2.96 × 10⁻¹⁵, nwt = 40, ntbx2a=40, ntbx2b=29; Conover-Iman posthoc corrected p-values: control vs. tbx2a p=1.71 × 10⁻¹⁹, control vs. tbx2b p=5.41 × 10⁻¹⁹); this increase was not significantly different between tbx2a and tbx2b F0 mutants (tbx2a vs. tbx2b p=1.0). (E) Quantification of the sum of rods and UV cones in control, tbx2a and tbx2b F0 mutants. Bars represent averages, error bars correspond to standard deviations, and markers correspond to individual retinas. Compared to control both tbx2a and tbx2b mutants have a significant decrease in the sum of rods and UV cones, but this decrease is significantly more pronounced in tbx2a F0 mutants (38.81% for tbx2a and 14.34% for tbx2b, Kruskal-Wallis H=50.156, p=1.29 × 10⁻¹¹, nwt = 40, ntbx2a=40, ntbx2b=29; Conover-Iman posthoc corrected p-values: control vs. tbx2a p=2.38 × 10⁻¹⁵, control vs. tbx2b p=6.72 × 10⁻³, tbx2a vs. tbx2b p=5.92 × 10⁻⁷).
|
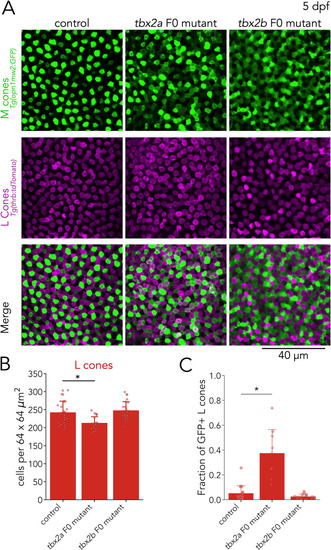
(A) Representative confocal images of the central retina of control, tbx2a and tbx2b F0 mutants at 5 dpf, in double transgenic larvae that label M cones — or M-opsin expressing cells — with GFP (green) and L cones with tdTomato (magenta). Both tbx2a and tbx2b F0 mutants display an increase in GFP-positive cells. In tbx2a F0 mutants, increase in GFP signal is restricted to tdTomato-positive cells which appear as double-positive (white) in merged images, while in tbx2b F0 mutants, increase in GFP signal is excluded from tdTomato-positive cells, producing a decrease in the space without fluorescence. (B) Compared to controls, tbx2a F0 mutants have a significant decrease in L cones (12.12% for tbx2a, Kruskal-Wallis H=18.264, p=1.08 × 10⁻⁴, nwt = 25, ntbx2a=21, ntbx2b=24; Conover-Iman posthoc corrected p-values: control vs. tbx2a P=1.21 × 10⁻³, control vs. tbx2b p=0.88, tbx2a vs. tbx2b p=3.98 × 10⁻⁵) (C) Quantification of the fraction of GFP-positive L cones (double positive cells in A) reveals a significant increase only in tbx2a F0 mutants (Kruskal-Wallis H=20.821, p=3.01 × 10⁻⁵, nwt = 18, ntbx2a=9, ntbx2b=17; Conover-Iman posthoc corrected p-values: control vs. tbx2a p=2.87 × 10⁻⁵, control vs. tbx2b p=0.63, tbx2a vs. tbx2b p=1.13 × 10⁻⁶).
|
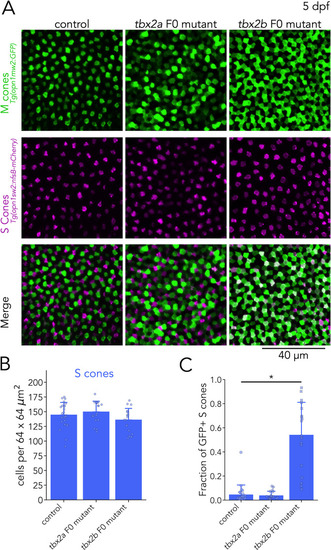
(A) Representative confocal images of the central retina of control, tbx2a and tbx2b F0 mutants at 5 dpf, in double transgenic larvae that label M cones — or M-opsin expressing cells — with GFP (green) and S cones with mCherry (magenta). Both tbx2a and tbx2b F0 mutants display an increase in GFP-positive cells. In tbx2a F0 mutants, increase in GFP signal is excluded from mCherry-positive cells, producing a decrease in the space without fluorescence, while in tbx2b F0 mutants, increase in GFP signal is restricted to mCherry-positive cells, which appear as double positive (white) in the merged images. (B) Quantification of S cones in the central retina shows no significant changes in either tbx2a or tbx2b F0 mutants compared to control (Kruskal-Wallis H=3.668, p=0.16, nwt = 24, ntbx2a=18, ntbx2b=18). (C) Quantification of the fraction of GFP-positive S cones (double positive cells in A) reveals a significant increase only in tbx2b F0 mutants (Kruskal-Wallis H=35.584, p=1.87 × 10⁻⁸, nwt = 24, ntbx2a=18, ntbx2b=18; Conover-Iman posthoc corrected p-values: control vs. tbx2a p=2.87 × 10⁻⁵, control vs. tbx2b p=0.63, tbx2a vs. tbx2b p=1.13 × 10⁻⁶).
|