
Figure 3
- ID
- ZDB-FIG-230211-60
- Publication
- Angueyra et al., 2023 - Transcription factors underlying photoreceptor diversity
- Other Figures
- All Figure Page
- Back to All Figure Page
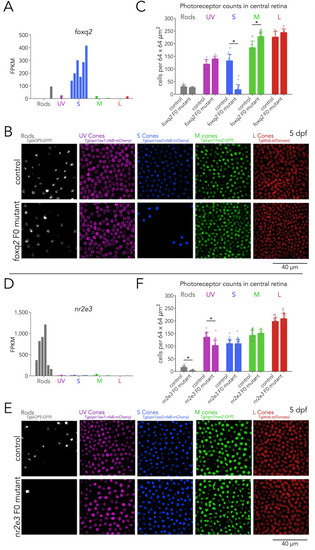
(A) Expression of foxq2 shows clear S-cone specificity. (B) Mutations in foxq2 cause a loss of S cones. Representative confocal images of the central retina of control (top row) and foxq2 F0 mutant (bottom row) larvae at 5 dpf. Each column corresponds to a transgenic line that labels a unique photoreceptor subtype, pseudo-colored according to photoreceptor subtype. (C) Quantification of photoreceptors in control and foxq2 F0 mutant larvae. Bars represent averages, error bars correspond to standard deviations, and markers correspond to individual retinas. There is a significant ~86% reduction in S cones in foxq2 F0 mutants compared to wildtype (wt) controls (Kruskal-Wallis H=22.93, p=1.6.×10–6,, nwt = 14, nfoxq2=18) and a smaller but significant ~24% increase in the density of M cones (Kruskal-Wallis H=17.55, p=2.8.×10–5, nwt = 13, nfoxq2=28). We found no significant differences in the densities of rods (Kruskal-Wallis H=0.784, p=0.376, nwt = 9, nfoxq2=6), UV cones (Kruskal-Wallis H=3.562, p=0.059, nwt = 9, nfoxq2=6), or L cones (Kruskal-Wallis H=2.267, p=0.132, nwt = 7, nfoxq2=8). (D) Expression of nr2e3 shows enrichment in rods. (E) Mutations in nr2e3 cause a loss of rods. Representative confocal images of the central retina of control (top row) and nr2e3 F0 mutant (bottom row) larvae at 5 dpf. (F) Quantification of photoreceptors in control and nr2e3 F0 mutant larvae. Bars represent averages, error bars correspond to standard deviations, and markers correspond to individual retinas. There is a significant ~80% reduction in rods in nr2e3 F0 mutants compared to controls (Kruskal-Wallis H=26.987, p=2.0 × 10⁻⁷, nwt = 19, nnr2e3=19), a smaller but significant ~25% reduction in UV cones (Kruskal-Wallis H=18.77, p=1.5 × 10⁻⁵, nwt = 24, nnr2e3=24). We found no significant differences in the densities of S cones (Kruskal-Wallis H=0.024, p=0.87, nwt = 30, nnr2e3=32), M cones (Kruskal-Wallis H=1.61, p=0.205, nwt = 30, nnr2e3=12), or L cones (Kruskal-Wallis H=2.407, p=0.12, nwt = 24, nnr2e3=22).
|