
Figure 2
- ID
- ZDB-FIG-230211-57
- Publication
- Angueyra et al., 2023 - Transcription factors underlying photoreceptor diversity
- Other Figures
- All Figure Page
- Back to All Figure Page
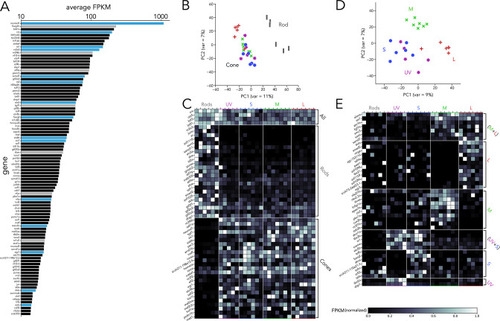
(A) Top 100 transcription factors ranked by average expression across all samples, displayed on a logarithmic scale. Genes highlighted in blue are known to be critical in photoreceptor progenitors or during photoreceptor development. Some limited information about function in photoreceptors exists for genes highlighted in grey. (B) Principal component analysis (PCA) of transcription factor expression shows that differences between rods and cones are the main source of variance. (C) Heatmap showing differential expression of transcription factors between rods and cones and divided into three groups: consistently expressed by all photoreceptors, enriched in rod samples, and enriched in cones samples. Grey values indicate expression level normalized by the maximal value in each row. Rod- and cone-enriched genes have been arranged by degree of enrichment. (D) PCA of cone samples shows that the largest differences in expression separate L cones (PC1) and M cones (PC2), while separation of UV and S cones is more difficult. (E) Heatmap of transcription factors differentially expressed in cone subtypes, divided into six relevant groups. Full list of differentially expressed transcription factors available in Supplementary file 2, Supplementary file 3.
|