
Figure 4
- ID
- ZDB-FIG-230211-68
- Publication
- Angueyra et al., 2023 - Transcription factors underlying photoreceptor diversity
- Other Figures
- All Figure Page
- Back to All Figure Page
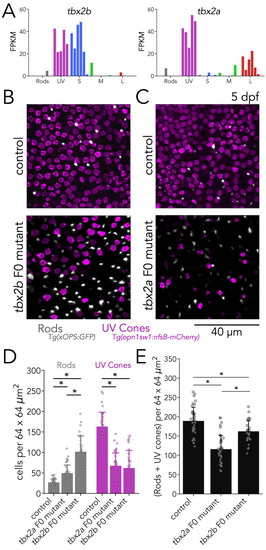
(A) tbx2b is expressed by UV and S cones (left), while tbx2a is expressed by UV and L cones (right). (B) Mutations in tbx2b cause a loss of UV cones and an increase in rods. Representative confocal images of the central retina of control and tbx2b F0 mutants at 5 dpf, in double transgenic larvae with labeled UV cones (magenta) and rods (grey). (C) Mutations in tbx2a also cause a loss of UV cones and an increase in rods. Representative confocal images of the central retina of control and tbx2a F0 mutants at 5 dpf, in the same double transgenic lines. (D) Quantification of rods and UV cones in control, tbx2a and tbx2b F0 mutant larvae. Bars represent averages, error bars correspond to standard deviations, and markers correspond to individual retinas. Compared to controls, both tbx2 F0 mutants have a significant increase in rods (1.86-fold for tbx2a and 3.86-fold for tbx2b, Kruskal-Wallis H=71.725, p=2.67 × 10⁻¹⁶, nwt = 40, ntbx2a=40, ntbx2b=30; Conover-Iman posthoc corrected p-values: control vs. tbx2a p=2.96 × 10⁻¹¹, control vs. tbx2b p=4.16 × 10⁻²⁶) but this increase significantly smaller in tbx2a F0 mutants (tbx2a vs. tbx2b p=2.25 × 10⁻¹⁰); both tbx2 F0 mutants have a marked decrease in UV cones (58.91% for tbx2a and 62.32% for tbx2b, Kruskal-Wallis H=66.907, p=2.96 × 10⁻¹⁵, nwt = 40, ntbx2a=40, ntbx2b=29; Conover-Iman posthoc corrected p-values: control vs. tbx2a p=1.71 × 10⁻¹⁹, control vs. tbx2b p=5.41 × 10⁻¹⁹); this increase was not significantly different between tbx2a and tbx2b F0 mutants (tbx2a vs. tbx2b p=1.0). (E) Quantification of the sum of rods and UV cones in control, tbx2a and tbx2b F0 mutants. Bars represent averages, error bars correspond to standard deviations, and markers correspond to individual retinas. Compared to control both tbx2a and tbx2b mutants have a significant decrease in the sum of rods and UV cones, but this decrease is significantly more pronounced in tbx2a F0 mutants (38.81% for tbx2a and 14.34% for tbx2b, Kruskal-Wallis H=50.156, p=1.29 × 10⁻¹¹, nwt = 40, ntbx2a=40, ntbx2b=29; Conover-Iman posthoc corrected p-values: control vs. tbx2a p=2.38 × 10⁻¹⁵, control vs. tbx2b p=6.72 × 10⁻³, tbx2a vs. tbx2b p=5.92 × 10⁻⁷).
|