
Fig. 8
- ID
- ZDB-FIG-221119-42
- Publication
- Edmister et al., 2021 - A zebrafish model for calcineurin-dependent brain function
- Other Figures
- All Figure Page
- Back to All Figure Page
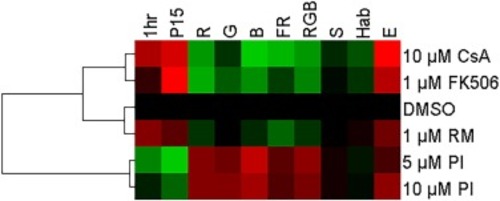
Fig. 8. Hierarchical cluster analysis of behavioral profiles. Behaviors at 5 dpf were analyzed in Cluster 3.0, using the Euclidian distance metric with complete linkage. The clusters were then color coded in TreeView using a spectrum from green (25 % decrease) to red (25 % increase). Three main clusters were identified, each with a distinct behavioral profile: 1) the calcineurin inhibitors FK506 and CsA, 2) DMSO and rapamycin (RM), and 3) the DYRK1A inhibitor ProINDY (PI) at two concentrations. Measurements behavior include activity in the first hour (1 h) and period 15 (P15), optomotor responses to moving lines in red (R), green (G), blue (B), fast red (FR) and all colors and speeds combined (RGB), startle response (S), habituation (Hab) and excitability (E). |