
FIGURE
Fig. 2
- ID
- ZDB-FIG-221119-36
- Publication
- Edmister et al., 2021 - A zebrafish model for calcineurin-dependent brain function
- Other Figures
- All Figure Page
- Back to All Figure Page
Fig. 2
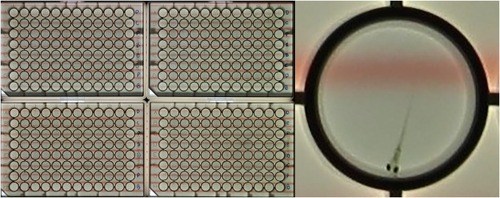
Fig. 2. Imaging of zebrafish larval behavior. Five-day-old larvae were imaged for 3 h in a 384-well format (four 96-well plates). Left: overview of four plates. Right: individual well with a zebrafish larva located ‘down’ in the lower half of the well (plate 4, well D5). Moving lines (red, green or blue) were projected through the bottom of the 96-well plates for measurements of the optomotor response (OMR). Larval activity and location were measured by automated image analysis to prevent observer bias and fatigue. Inner well diameter = 7.15 mm. |
Expression Data
Expression Detail
Antibody Labeling
Phenotype Data
Phenotype Detail
Acknowledgments
This image is the copyrighted work of the attributed author or publisher, and
ZFIN has permission only to display this image to its users.
Additional permissions should be obtained from the applicable author or publisher of the image.
Full text @ Behav. Brain Res.