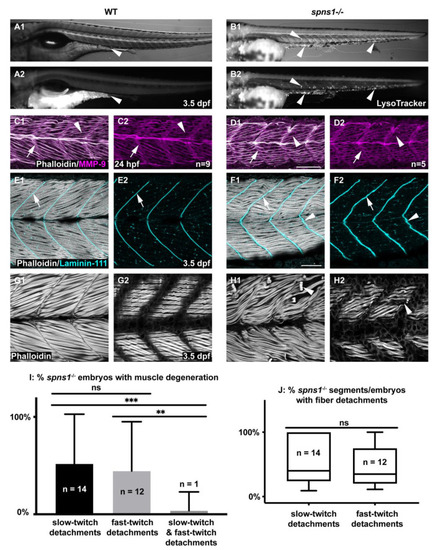
Developmental characterization of spns1−/− embryos and larvae. Anterior left, dorsal top, side-mounted embryos and larvae. (A1,B1) WT and (A2,B2) spns1−/− brightfield and LysoTracker staining at 3.5 dpf. Arrowheads indicate enlarged LysoTracker positive puncta in spns1−/− larvae. (C1–D2) Phalloidin staining (white) for actin and MMP-9 antibody (purple) staining in 1 dpf embryos. (C1) Merged WT and (D1) spns1−/− channels and (C2,D2) single MMP-9 channel. Arrows indicate MMP-9 staining at the MTJ while arrowheads indicate MMP-9 staining localized at muscle fibers. Scale bar 50 µm (E1–F2) Phalloidin staining (white) and beta-dystroglycan antibody (cyan) staining in 3.5 dpf larvae. (E1) WT and (F1) spns1−/− merged channels and (E2,F2) beta-dystroglycan single channel. Arrows indicate beta-dystroglycan staining at the MTJ while arrowheads indicate wavy beta-dystroglycan staining at the MTJ in spns1−/− larvae. Scale bar 50 µm. (G1,G2,H1,H2) Phalloidin staining of WT and spns1−/− fast and slow muscle fibers in 3.5 dpf larvae. Arrowheads indicate fiber detachments in spns1−/− larvae. Scale same as (F1). (I) Quantification of spns1−/− larvae (n = 27) with slow, fast, or both types of muscle fiber detachments. (J) Quantification of the percent of total myotomes in spns1−/− larvae (n = 27) with fast or slow muscle fiber detachments. Box and Whisker plot with whiskers denoting minimum and maximum values. ** for p < 0.01, and *** for p < 0.001.
|
