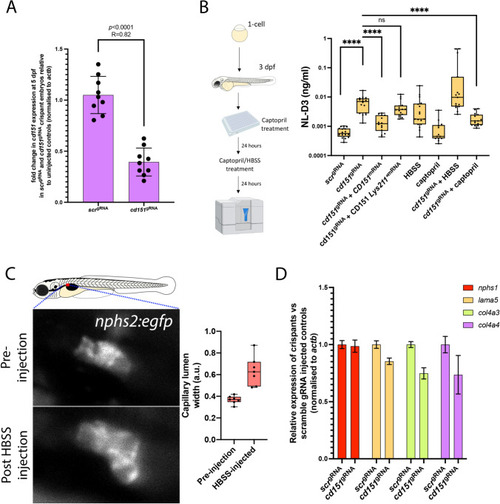
Depletion of cd151 in zebrafish recapitulates human phenotypes. A) Histogram shows RT-PCR for scrambled gRNA-injected controls and cd151 gRNA-injected crispants. Each data point is a biological replicate (n = 9), and relative expression is to un-injected wild-type controls. All Ct values were normalised to actb expression. B) Schematic on left shows experimental set-up for zebrafish proteinuria analysis. Histogram shows the levels of proteinuria (in relative luminescence units (RLUs)) of the indicated treatments. C) Top panel shows a normal glomerulus in a 3 dpf nphs2:egfp zebrafish embryo. Bottom panel shows the same embryo with a dilated glomerulus 1 h after HBSS injection into the cardiac cavity. Histogram illustrates the measurements of capillary width in the glomeruli of embryos pre- and post-HBSS injection. D) Histogram of RT-PCR results showing the relative gene expression of the indicated genes in cd151 crispant embryos compared to stage-matched controls. All gene expression data were normalised to actb
|
