FIGURE

Fig. 2

ID
ZDB-FIG-221026-64
Publication
Naylor et al., 2022 - Basement membrane defects in CD151-associated glomerular disease
Other Figures
All Figure Page
Back to All Figure Page
Fig. 2

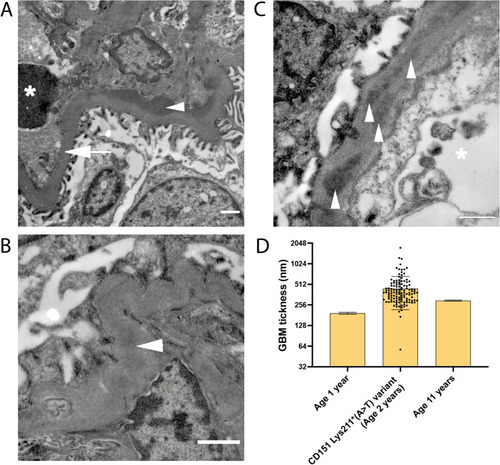
TEM images showing changes in GBM in patient with loss of function variant in the CD151 gene. A) Thickened region of GBM (arrow) opposite to the capillary lumen containing an erythrocyte (asterisk). Electron dense deposits can be seen in the GBM para-mesangial region (arrowhead). B) Wrinkling of GBM around mesangial regions was observed along with electron-dense deposits (arrowhead). C) Smaller electron dense deposits (arrowheads) within the subepithelial region of the GBM (asterisk: capillary lumen). Scale bars = 1 µm. D) quantification of patient GBM thickness based on TEM images of the case patient kidney biopsy and previously published measurements of GBM thickness in a one- and 11-year-old extrapolated from Ramage et al. (2002). Measurements were taken in Fiji/ImageJ, and mean ± SD was calculated in GraphPad Prism

Expression Data

Expression Detail
Antibody Labeling
Phenotype Data

Phenotype Detail
Acknowledgments
This image is the copyrighted work of the attributed author or publisher, and ZFIN has permission only to display this image to its users. Additional permissions should be obtained from the applicable author or publisher of the image. Full text @ Pediatr. Nephrol.