
Fig. 7
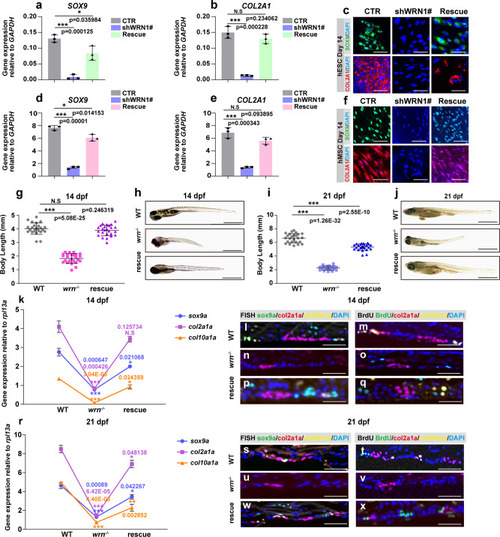
SHOX restores chondrogenesis in WS.
a, b, d, e qRT-PCR measurement of the expression of SOX9 and COL2A1 among CTR, shWRN1#, and rescue groups during chondrogenesis on day 14 in hESCs and hMSCs. N = 3 independent biological experiments. c, f Representative immunofluorescent staining of 3 independent experiments among CTR, shWRN1#, and rescue groups on day 14 in hESCs and hMSCs. SOX9 and COL2A1 were examined. Scale bar = 50 µm. g, i Dot graph analysis of the total body length among WT, wrn−/− mutant, and rescue groups on 14 dpf (h) and 21 dpf (i). N = 25 independent zebrafish embryos for WT, wrn−/− mutant, and rescue groups, respectively. Each dot represents a biological replicate. h, j Representative bright-field images of 3 independent experiments among WT, wrn−/− mutant, and rescue groups on 14 dpf (h) and 21 dpf (j). Scale bar = 100 µm. k, r qRT-PCR measurement of genes (sox9a, col2a1a, and col10a1a) on 14 dpf (k) and 21 dpf (r). N = 3 independent biological experiments. l–q and s–x Representative FISH and BrdU analysis of 3 independent experiments of chondrogenic markers (sox9a, col2a1a, and col10a1a) on 14 dpf (l–q) and 21 dpf (s–x). Scale bar = 100 µm. Data are presented as the mean ± S.D. Statistical analysis was performed using two-tailed unpaired Student’s t-test. *P < 0.05, **P < 0.01, ***P < 0.001. |
| Genes: | |
|---|---|
| Fish: | |
| Anatomical Terms: | |
| Stage: | Days 14-20 |
| Fish: | |
|---|---|
| Observed In: | |
| Stage Range: | Days 14-20 to Days 21-29 |