
Fig. 6
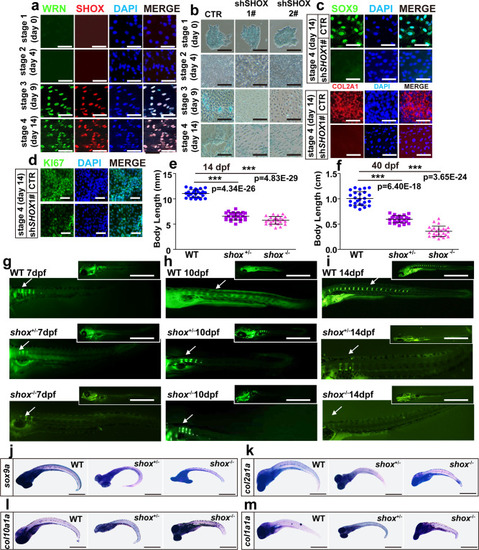
SHOX is a crucial regulator in WS bone development.
a Representative immunofluorescent staining of 3 independent experiments in CTR-hESCs with four sequential time points. WRN and SHOX were examined. Scale bar = 50 µm. b Representative alcian blue staining of 3 independent experiments between CTR and two KD-SHOX groups. Scale bar = 20 µm. c Representative immunofluorescent staining of 3 independent experiments between CTR and shSHOX1# groups on day 14 in hESCs. SOX9 and COL2A1 were examined. Scale bar = 50 µm. d Representative immunofluorescent staining of 3 independent experiments between CTR and shSHOX1# groups on day 14 in hESCs. Ki67 was examined. Scale bar = 20 µm. e, f Dot graph analysis of the total body length among WT, shox+/-, and shox−/− mutants on 14 dpf (e) and 40 dpf (f). Each dot represents a biological replicate. N = 25 independent embryos for WT, shox+/-, and shox−/− mutants, respectively. Three independent biological experiments were performed. Data are presented as the mean ± S.D. g–i Representative calcein staining of 3 independent experiments among WT, shox+/-, and shox−/− mutants from 7 dpf to 14 dpf. White arrows indicate vertebrate regions. Scale bar = 100 µm. j–m Representative WISH analysis of 3 independent experiments of chondrogenic markers (sox9a, col2a1a, col10a1a, and col1a1a) on 7 dpf. Scale bar = 50 µm. Statistical analysis was performed using two-tailed unpaired Student’s t-test. *P < 0.05, **P < 0.01, ***P < 0.001. |
| Genes: | |
|---|---|
| Fish: | |
| Anatomical Term: | |
| Stage: | Days 7-13 |
| Fish: | |
|---|---|
| Observed In: | |
| Stage Range: | Days 7-13 to Days 30-44 |