
Fig. 7
- ID
- ZDB-FIG-220718-30
- Publication
- Darp et al., 2022 - Oncogenic BRAF induces whole-genome doubling through suppression of cytokinesis
- Other Figures
- All Figure Page
- Back to All Figure Page
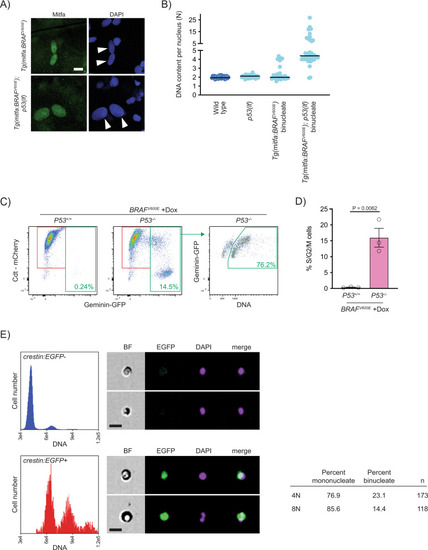
Progression of p53-mutant BRAFV600E-induced tetraploid cells.
A Anti-Mitfa and DAPI staining of nuclei in Tg(mitfa:BRAFV600E) and Tg(mitfa:BRAFV600E); p53(lf) melanocytes. Melanin pigment was bleached to more clearly visualize nuclear size. White arrowheads indicate two nuclei within a single melanocyte. Scale bar = 10 μm. B DNA content per nucleus as measured by confocal densitometry. Each data point represents a single nucleus. N = 25 nuclei for wild type, N = 31 for p53(lf), N = 35 for binucleate Tg(mitfa:BRAFV600E), and N = 42 for binucleate Tg(mitfa:BRAFV600E);p53(lf) cells. Bars represent median. C Flow cytometry plots of BRAFV600E-expressing (+Dox) p53 wild-type (left) and p53 mutant (middle) tetraploid cells. Prior to analysis, RPE-1 FUCCI G1 tetraploid cells were isolated and plated for 24 h in the presence of nocodazole. Percentages of Geminin-GFP-positive cells in S/G2/M are indicated. Flow cytometry plot of BRAFV600E-expressing (+Dox) p53 mutant S/G2/M cells (right). Percentage of ≥4 N S/G2/M cells is indicated. D Percent S/G2/M cells from flow cytometry analysis in (C). N = 3 independent experiments. Unpaired Student’s t test. Error bars represent mean ± SEM. E Flow cytometry and DNA content analysis of normal tissue (left, top) and nascent melanomas (left, bottom) from Tg(crestin:EGFP); Tg(mitfa:BRAFV600E); p53(lf) zebrafish. Brightfield, EGFP and DAPI images of single melanocytes are shown. Quantification of percent mononucleate and binucleate cells in the 4N and 8N peaks of nascent melanomas (right). |
| Gene: | |
|---|---|
| Fish: | |
| Anatomical Term: | |
| Stage: | Adult |
| Fish: | |
|---|---|
| Observed In: | |
| Stage: | Adult |