
Fig. 5
- ID
- ZDB-FIG-220718-28
- Publication
- Darp et al., 2022 - Oncogenic BRAF induces whole-genome doubling through suppression of cytokinesis
- Other Figures
- All Figure Page
- Back to All Figure Page
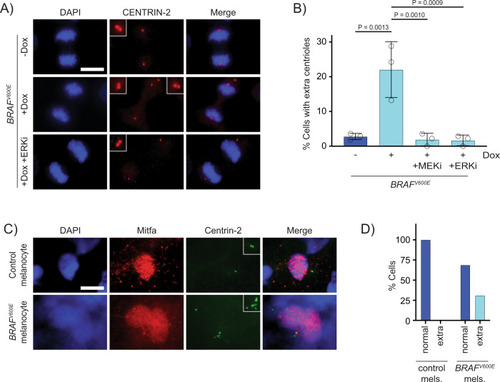
Supernumerary centrioles are observed in BRAFV600E-expressing cells.
A DAPI and anti-CENTRIN-2 staining in control (−Dox) and BRAFV600E-expressing (+Dox) anaphase RPE-1 cells. Insets show centrioles at one pole. Images are maximum intensity projections of z-stacks. Scale bar = 7.5 µM. B Percent cells with supernumerary (>4) centrioles in control RPE-1 cells, BRAFV600E-expressing cells and BRAFV600E-expressing cells treated with MEKi or ERKi. Quantification of RPE-1 cells in mitosis with supernumerary (>4) centrioles. Drugs were added coincident with Dox administration. N = 3 independent experiments examining −Dox = 131, +Dox = 169, +Dox +MEKi = 85, and +Dox +ERKi = 91 cells. One-way ANOVA with Tukey’s multiple comparisons test. Error bars represent mean ± SEM. C DAPI, anti-Mitfa and anti-Centrin-2 staining of control Tg(mitfa:EGFP); alb(lf) and Tg(mitfa:EGFP); Tg(mitfa:BRAFV600E); alb(lf) non-cycling zebrafish melanocytes. Scale bar = 7.5 µM. Insets show centrioles. D Percent cells with normal (2) and extra (>2) centrioles in control Tg(mitfa:EGFP); alb(lf) and Tg(mitfa:EGFP); Tg(mitfa:BRAFV600E); alb(lf) zebrafish melanocytes. N = 36 melanocytes for Tg(mitfa:EGFP); alb(lf) and N = 50 for Tg(mitfa:EGFP); Tg(mitfa:BRAFV600E); alb(lf). Chi-square test P = 0.000843. |