
- Title
-
Oncogenic BRAF induces whole-genome doubling through suppression of cytokinesis
- Authors
- Darp, R., Vittoria, M.A., Ganem, N.J., Ceol, C.J.
- Source
- Full text @ Nat. Commun.
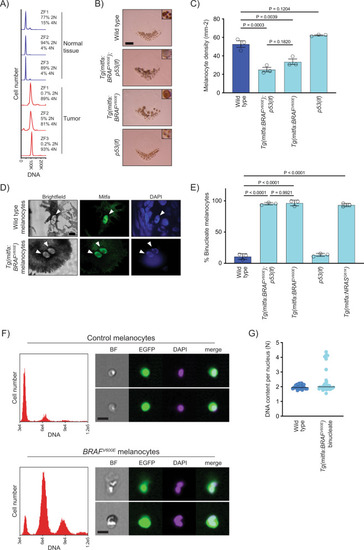
BRAFV600E causes melanocytes in zebrafish to be tetraploid.
A DNA content of normal and tumor tissue from Tg(mitfa:EGFP); Tg(mitfa:BRAFV600E); p53(lf); alb(lf) zebrafish. ZF1, ZF2, and ZF3 are three different animals. B Scales from wild-type, Tg(mitfa:BRAFV600E);p53(lf), Tg(mitfa:BRAFV600E) and p53(lf) strains. Melanin pigment is dispersed throughout the cytoplasm of zebrafish melanocytes, revealing markedly different cell sizes. Scale bar = 250 μm, insets are at same scale as one another. C Quantification of melanocyte densities per scale of wild-type, Tg(mitfa:BRAFV600E);p53(lf), Tg(mitfa:BRAFV600E) and p53(lf) strains. N = 5 for three animals of each genotype; the mean density of each animal is plotted. One-way ANOVA with Tukey’s multiple comparisons test. Error bars represent mean ± SEM. D Images from brightfield (left), anti-Mitfa (middle) and DAPI (right) staining of a single wild-type (top) or Tg(mitfa:BRAFV600E) (bottom) epidermal melanocyte. Only the melanocyte nuclei stain positively for Mitfa. White arrowheads indicate nuclei within a single melanocyte. Scale bar = 5 μm. Representative cells quantified in E are shown. E Mean percent binucleate cells as determined by anti-Mitfa staining of pigmented melanocytes. N = 3 experiments examining in total wild type = 636, Tg(mitfa:BRAFV600E);p53(lf) = 458, Tg(mitfa:BRAFV600E) = 454, p53(lf) = 538, and Tg(mitfa:NRASQ61K) = 122 melanocytes. One-way ANOVA with Tukey’s multiple comparisons test. Error bars represent mean ± SEM. F Flow cytometry and DNA content analysis of control Tg(mitfa:EGFP); alb(lf) and Tg(mitfa:EGFP); Tg(mitfa:BRAFV600E); alb(lf) melanocytes with brightfield, EGFP and DAPI images of single melanocytes. G DNA content analysis of wild-type and Tg(mitfa:BRAFV600E) melanocyte nuclei by confocal densitometry. N = 25 nuclei for wild type and N = 35 for Tg(mitfa:BRAFV600E). Bars represent median. |
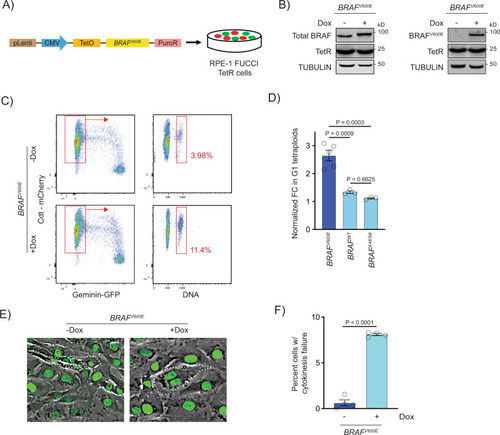
BRAFV600E-induced binucleate, tetraploid cells arise via cytokinesis failure.
A Generation of BRAFV600E-expressing RPE-1 FUCCI cell lines with a lentiviral-based doxycycline-inducible vector. B Western blot showing inducible expression of BRAFV600E (+Dox) in RPE-1 FUCCI cells using a BRAF and BRAFV600E-specific antibody. Expression of the Tet repressor protein is shown. TUBULIN was used as the loading control. A representative of three independent biological replicates is shown. C Flow cytometry plots of control (−Dox) and BRAFV600E-expressing (+Dox) RPE-1 FUCCI cells. Tetraploid cells accumulating in G1 were quantified based on Cdt1-mCherry positivity and Hoechst incorporation. Percentages of G1 tetraploid cells in control and BRAFV600E-expressing cultures are indicated. D Fold change (FC) in G1 tetraploids normalized to the control (−Dox) are shown for BRAFV600E, BRAFWT and BRAFK483W (kinase-dead) -expressing RPE-1 FUCCI cell lines. N = 5 independent experiments for BRAFV600E, N = 3 for BRAFWT and N = 3 for BRAFK483W. One-way ANOVA with Tukey’s multiple comparisons test. Error bars represent mean ± SEM. E Merged phase contrast and GFP photomicrographs of H2B-GFP expressing control (−Dox) and BRAFV600E-expressing (+Dox) RPE-1 cells that have recently undergone mitosis. White dotted lines indicate 2 cells with 1 nucleus each that have separated following a successful cytokinesis (−Dox) and 1 cell with 2 nuclei that has failed cytokinesis (+Dox). F Percentages of cells exhibiting cytokinesis failure in H2B-GFP RPE-1 control (−Dox) and BRAFV600E-expressing (+Dox) cells. N = 4 independent experiments examining -Dox = 934 and +Dox = 568 cells. Unpaired Student’s t test. Error bars represent mean ± SEM. |
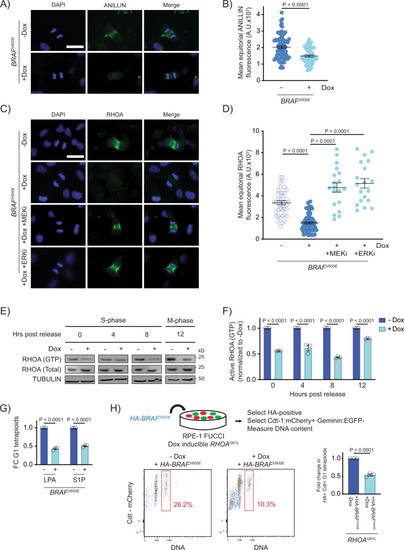
BRAFV600E causes cytokinesis failure by reducing the localization and function of RhoA.
A DAPI and anti-ANILLIN staining in control (−Dox) and BRAFV600E-expressing (+Dox) anaphase RPE-1 cells. Images are maximum intensity projections of z-stacks. Scale bar = 7.5 µM. B Mean ANILLIN fluorescence intensity at the equator of control and BRAFV600E-expressing anaphase RPE-1 cells. N = 79 cells for −Dox and N = 53 for +Dox. Unpaired Student’s t test. Error bars represent mean ± SEM. C DAPI and anti-RHOA staining in -BRAFV600E (−Dox) cells, BRAFV600E-expressing (+Dox) cells, and BRAFV600E-expressing (+Dox) RPE-1 cells treated with MEKi or ERKi. Drugs were added coincident with Dox administration. Images are maximum intensity projections of z-stacks (0.20 µM). Scale bar = 7.5 µM. D Mean RHOA fluorescence intensity at the equator of control RPE-1 cells, BRAFV600E-expressing RPE-1 cells, and BRAFV600E-expressing RPE-1 cells treated with MEKi or ERKi. N = 41 cells for −Dox, N = 68 for +Dox, N = 19 for +Dox +MEKi, and N = 19 for +Dox +ERKi. Brown-Forsythe and Welch one-way ANOVA with Dunnett’s multiple comparisons test. Error bars represent mean ± SEM. E Western blot analysis of immunoprecipitated RHOA-GTP from control (−Dox) and BRAFV600E-expressing (+Dox) RPE-1 cell lysates at different time points post thymidine release. Total RHOA protein and alpha tubulin were used as a controls. A representative of three independent biological replicates is shown. F Western blot quantification of immunoprecipitated RHOA-GTP levels from control (−Dox) and BRAFV600E-expressing (+Dox) RPE-1 cell lysates at different time points post thymidine release. Samples were normalized to the −Dox condition. N = 3 independent experiments. Unpaired Student’s t test. Error bars represent mean ± SEM. G Fold change (FC) in G1 tetraploid RPE-1 FUCCI cells following addition of RHOA activators. LPA (1 µM) and S1P (1 µM) were added coincident with Dox administration. Fold changes in G1 tetraploids relative to the control (+Dox no drug) are shown. N = 3 independent experiments. Unpaired Student’s t test. Error bars represent mean ± SEM. H G1 tetraploid generation following expression of HA-tagged-BRAFV600E in RHOAQ61L-inducible cells. Experimental design (top): RPE-1 FUCCI cells with Dox inducible RHOAQ61L were transiently transfected with an HA-tagged-BRAFV600E-expressing construct and selected accordingly. G1 tetraploids were quantified (bottom left and middle) by gating HA-positive, Cdt-1:mCherry-positive cells with increased Hoechst incorporation. Fold change in G1 tetraploids (bottom right), normalized to control (−Dox) cells. N = 3 independent experiments. Unpaired Student’s t test. Error bars represent mean ± SEM. |

BRAFV600E acts during G1/S and activates RAC1 to downregulate RhoA and generate tetraploid cells.
A Fold change in G1 RPE-1 FUCCI tetraploids following inhibitor treatment. Fold changes are expressed relative to control (+BRAFV600E, no drug) samples. Inhibitors were added at indicated timepoints. N = 4 independent experiments. One-way ANOVA with Dunnett’s multiple comparisons test. Error bars represent mean ± SEM. B ELISA-based quantification of RAC1-GTP levels in control (−Dox) and BRAFV600E-expressing (+Dox) RPE-1 cells. Cells were measured at the indicated timepoints post thymidine release. RAC-1 GTP signal was measured using a colorimetric assay at 490 nM absorbance. N = 3 independent experiments. Unpaired Student’s t test. Error bars represent mean ± SEM. C Fold change (FC) in G1 RPE-1 FUCCI tetraploids following addition of RAC1 inhibitors. NSC2366 and EHT1864 were added coincident with BRAFV600E induction. Fold changes are expressed relative to control (+BRAFV600E, no drug) cells. N = 3 independent experiments. Unpaired Student’s t test. Error bars represent mean ± SEM. D DAPI and anti-RHOA staining in -BRAFV600E (−Dox) cells, BRAFV600E-expressing (+Dox) cells, and BRAFV600E-expressing (+Dox) RPE-1 cells treated with NSC2366 or EHT1864. Drugs were added coincident with Dox administration. Images are maximum intensity projections of z-stacks (0.20 µM). Scale bar = 7.5 µM. E Mean RHOA fluorescence intensity at the equator of control RPE-1 cells, BRAFV600E-expressing RPE-1 cells, and BRAFV600E-expressing RPE-1 cells treated with NSC2366 or EHT1864. Fluorescence intensities (mean gray values) of the equator were measured by sum intensity projections of z-stacks. N = 40 cells for −Dox, N = 38 for +Dox, N = 38 for +Dox +NSC2366, and N = 36 for +Dox +EHT1864. Brown-Forsythe and Welch one-way ANOVA with Dunnett’s multiple comparisons test. Error bars represent mean ± SEM. |
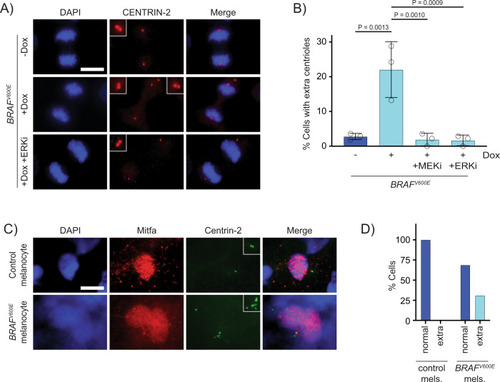
Supernumerary centrioles are observed in BRAFV600E-expressing cells.
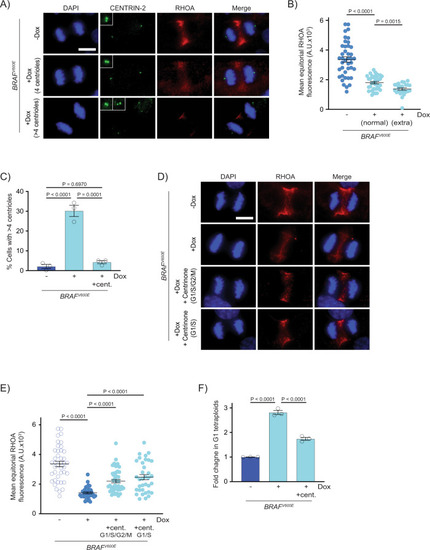
A DAPI and anti-CENTRIN-2 staining in control (−Dox) and BRAFV600E-expressing (+Dox) anaphase RPE-1 cells. Insets show centrioles at one pole. Images are maximum intensity projections of z-stacks. Scale bar = 7.5 µM. B Percent cells with supernumerary (>4) centrioles in control RPE-1 cells, BRAFV600E-expressing cells and BRAFV600E-expressing cells treated with MEKi or ERKi. Quantification of RPE-1 cells in mitosis with supernumerary (>4) centrioles. Drugs were added coincident with Dox administration. N = 3 independent experiments examining −Dox = 131, +Dox = 169, +Dox +MEKi = 85, and +Dox +ERKi = 91 cells. One-way ANOVA with Tukey’s multiple comparisons test. Error bars represent mean ± SEM. C DAPI, anti-Mitfa and anti-Centrin-2 staining of control Tg(mitfa:EGFP); alb(lf) and Tg(mitfa:EGFP); Tg(mitfa:BRAFV600E); alb(lf) non-cycling zebrafish melanocytes. Scale bar = 7.5 µM. Insets show centrioles. D Percent cells with normal (2) and extra (>2) centrioles in control Tg(mitfa:EGFP); alb(lf) and Tg(mitfa:EGFP); Tg(mitfa:BRAFV600E); alb(lf) zebrafish melanocytes. N = 36 melanocytes for Tg(mitfa:EGFP); alb(lf) and N = 50 for Tg(mitfa:EGFP); Tg(mitfa:BRAFV600E); alb(lf). Chi-square test P = 0.000843. |
Supernumerary centrioles contribute to RhoA downregulation and BRAFV600E-induced tetraploidy.
A DAPI, anti-CENTRIN-2 and anti-RHOA staining in control (−Dox) and BRAFV600E-expressing (+Dox) anaphase RPE-1 cells. Insets show centrioles at one pole. Images are maximum intensity projections of z-stacks. Scale bar = 7.5 µM. B Mean RHOA fluorescence intensity at the equator of control RPE-1 anaphase cells (n = 30) and BRAFV600E-expressing RPE-1 anaphase cells with normal (4) and supernumerary (>4) centrosomes. N = 41 cells for −Dox, N = 35 for +Dox with normal centrioles, and N = 24 for +Dox with supernumerary centrioles. Brown-Forsythe and Welch one-way ANOVA with Dunnett’s multiple comparisons test. Error bars represent mean ± SEM. C Percent RPE-1 cells in mitosis with supernumerary (>4) centrioles in control RPE-1 cells, BRAFV600E-expressing RPE-1 cells and BRAFV600E-expressing RPE-1 cells treated with Centrinone. Centrinone was added coincident with Dox administration. N = 3 independent experiments examining −Dox = 119, +Dox = 124, +Dox +Centrinone = 122 cells. One-way ANOVA with Tukey’s multiple comparisons test. Error bars represent mean ± SEM. D DAPI and anti-RHOA staining in -BRAFV600E (−Dox) RPE-1 cells, BRAFV600E-expressing (+Dox) RPE-1 cells, and BRAFV600E-expressing (+Dox) RPE-1 cells treated with Centrinone. Centrinone was added coincident with Dox administration (G1/S/G2/M) or only during G1/S. Images are maximum intensity projections of z-stacks (0.20 µM). Scale bar = 7.5 µM. E Mean RHOA fluorescence intensity at the equator of control RPE-1 cells, BRAFV600E-expressing RPE-1 cells, and BRAFV600E-expressing RPE-1 cells treated with Centrinone coincident with Dox administration (G1/S/G2/M) or only during G1/S. N = 41 cells for −Dox, N = 39 for +Dox, N = 44 for +Dox +Centrinone in G1/S/G2/M, and N = 35 for +Dox +Centrinone in G1/S. Brown-Forsythe and Welch one-way ANOVA with Dunnett’s multiple comparisons test. Error bars represent mean ± SEM. F Fold change in G1 tetraploids in control RPE-1 FUCCI cells (−Dox), BRAFV600E-expressing RPE-1 FUCCI cells (+Dox) and BRAFV600E-expressing RPE-1 FUCCI cells treated with Centrinone (+Dox +cent.). Fold changes are expressed relative to the control cells. N = 3 independent experiments. One-way ANOVA with Tukey’s multiple comparisons test. Error bars represent mean ± SEM. |
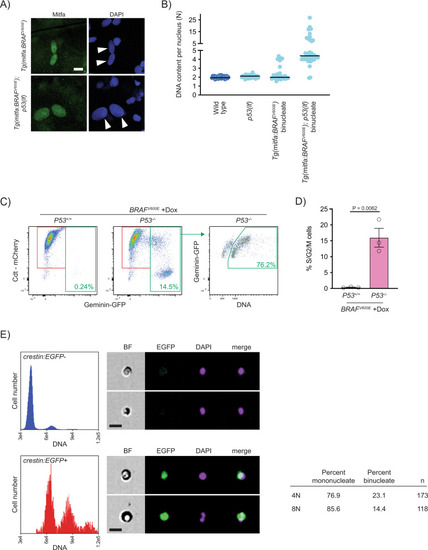
Progression of p53-mutant BRAFV600E-induced tetraploid cells.
A Anti-Mitfa and DAPI staining of nuclei in Tg(mitfa:BRAFV600E) and Tg(mitfa:BRAFV600E); p53(lf) melanocytes. Melanin pigment was bleached to more clearly visualize nuclear size. White arrowheads indicate two nuclei within a single melanocyte. Scale bar = 10 μm. B DNA content per nucleus as measured by confocal densitometry. Each data point represents a single nucleus. N = 25 nuclei for wild type, N = 31 for p53(lf), N = 35 for binucleate Tg(mitfa:BRAFV600E), and N = 42 for binucleate Tg(mitfa:BRAFV600E);p53(lf) cells. Bars represent median. C Flow cytometry plots of BRAFV600E-expressing (+Dox) p53 wild-type (left) and p53 mutant (middle) tetraploid cells. Prior to analysis, RPE-1 FUCCI G1 tetraploid cells were isolated and plated for 24 h in the presence of nocodazole. Percentages of Geminin-GFP-positive cells in S/G2/M are indicated. Flow cytometry plot of BRAFV600E-expressing (+Dox) p53 mutant S/G2/M cells (right). Percentage of ≥4 N S/G2/M cells is indicated. D Percent S/G2/M cells from flow cytometry analysis in (C). N = 3 independent experiments. Unpaired Student’s t test. Error bars represent mean ± SEM. E Flow cytometry and DNA content analysis of normal tissue (left, top) and nascent melanomas (left, bottom) from Tg(crestin:EGFP); Tg(mitfa:BRAFV600E); p53(lf) zebrafish. Brightfield, EGFP and DAPI images of single melanocytes are shown. Quantification of percent mononucleate and binucleate cells in the 4N and 8N peaks of nascent melanomas (right). |