
Fig. 1
- ID
- ZDB-FIG-220718-24
- Publication
- Darp et al., 2022 - Oncogenic BRAF induces whole-genome doubling through suppression of cytokinesis
- Other Figures
- All Figure Page
- Back to All Figure Page
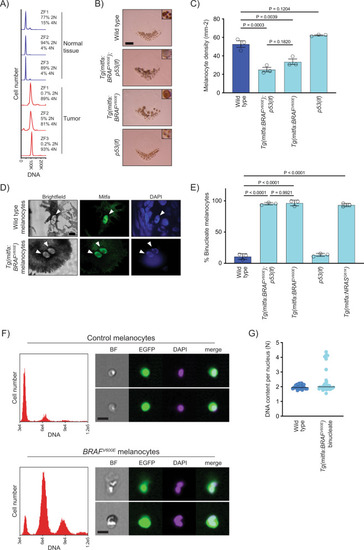
BRAFV600E causes melanocytes in zebrafish to be tetraploid.
A DNA content of normal and tumor tissue from Tg(mitfa:EGFP); Tg(mitfa:BRAFV600E); p53(lf); alb(lf) zebrafish. ZF1, ZF2, and ZF3 are three different animals. B Scales from wild-type, Tg(mitfa:BRAFV600E);p53(lf), Tg(mitfa:BRAFV600E) and p53(lf) strains. Melanin pigment is dispersed throughout the cytoplasm of zebrafish melanocytes, revealing markedly different cell sizes. Scale bar = 250 μm, insets are at same scale as one another. C Quantification of melanocyte densities per scale of wild-type, Tg(mitfa:BRAFV600E);p53(lf), Tg(mitfa:BRAFV600E) and p53(lf) strains. N = 5 for three animals of each genotype; the mean density of each animal is plotted. One-way ANOVA with Tukey’s multiple comparisons test. Error bars represent mean ± SEM. D Images from brightfield (left), anti-Mitfa (middle) and DAPI (right) staining of a single wild-type (top) or Tg(mitfa:BRAFV600E) (bottom) epidermal melanocyte. Only the melanocyte nuclei stain positively for Mitfa. White arrowheads indicate nuclei within a single melanocyte. Scale bar = 5 μm. Representative cells quantified in E are shown. E Mean percent binucleate cells as determined by anti-Mitfa staining of pigmented melanocytes. N = 3 experiments examining in total wild type = 636, Tg(mitfa:BRAFV600E);p53(lf) = 458, Tg(mitfa:BRAFV600E) = 454, p53(lf) = 538, and Tg(mitfa:NRASQ61K) = 122 melanocytes. One-way ANOVA with Tukey’s multiple comparisons test. Error bars represent mean ± SEM. F Flow cytometry and DNA content analysis of control Tg(mitfa:EGFP); alb(lf) and Tg(mitfa:EGFP); Tg(mitfa:BRAFV600E); alb(lf) melanocytes with brightfield, EGFP and DAPI images of single melanocytes. G DNA content analysis of wild-type and Tg(mitfa:BRAFV600E) melanocyte nuclei by confocal densitometry. N = 25 nuclei for wild type and N = 35 for Tg(mitfa:BRAFV600E). Bars represent median. |
| Gene: | |
|---|---|
| Fish: | |
| Anatomical Term: | |
| Stage: | Adult |
| Fish: | |
|---|---|
| Conditions: | |
| Observed In: | |
| Stage: | Adult |