
Fig. 6
- ID
- ZDB-FIG-220718-29
- Publication
- Darp et al., 2022 - Oncogenic BRAF induces whole-genome doubling through suppression of cytokinesis
- Other Figures
- All Figure Page
- Back to All Figure Page
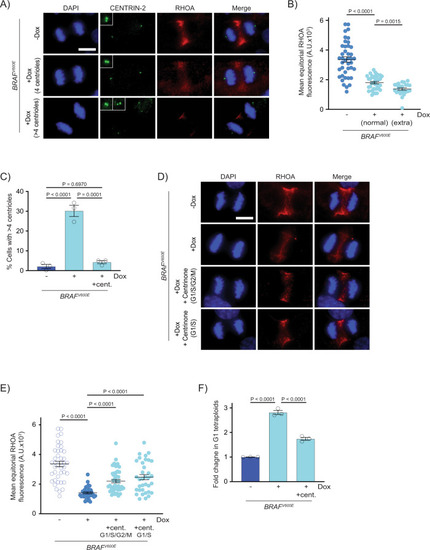
Supernumerary centrioles contribute to RhoA downregulation and BRAFV600E-induced tetraploidy.
A DAPI, anti-CENTRIN-2 and anti-RHOA staining in control (−Dox) and BRAFV600E-expressing (+Dox) anaphase RPE-1 cells. Insets show centrioles at one pole. Images are maximum intensity projections of z-stacks. Scale bar = 7.5 µM. B Mean RHOA fluorescence intensity at the equator of control RPE-1 anaphase cells (n = 30) and BRAFV600E-expressing RPE-1 anaphase cells with normal (4) and supernumerary (>4) centrosomes. N = 41 cells for −Dox, N = 35 for +Dox with normal centrioles, and N = 24 for +Dox with supernumerary centrioles. Brown-Forsythe and Welch one-way ANOVA with Dunnett’s multiple comparisons test. Error bars represent mean ± SEM. C Percent RPE-1 cells in mitosis with supernumerary (>4) centrioles in control RPE-1 cells, BRAFV600E-expressing RPE-1 cells and BRAFV600E-expressing RPE-1 cells treated with Centrinone. Centrinone was added coincident with Dox administration. N = 3 independent experiments examining −Dox = 119, +Dox = 124, +Dox +Centrinone = 122 cells. One-way ANOVA with Tukey’s multiple comparisons test. Error bars represent mean ± SEM. D DAPI and anti-RHOA staining in -BRAFV600E (−Dox) RPE-1 cells, BRAFV600E-expressing (+Dox) RPE-1 cells, and BRAFV600E-expressing (+Dox) RPE-1 cells treated with Centrinone. Centrinone was added coincident with Dox administration (G1/S/G2/M) or only during G1/S. Images are maximum intensity projections of z-stacks (0.20 µM). Scale bar = 7.5 µM. E Mean RHOA fluorescence intensity at the equator of control RPE-1 cells, BRAFV600E-expressing RPE-1 cells, and BRAFV600E-expressing RPE-1 cells treated with Centrinone coincident with Dox administration (G1/S/G2/M) or only during G1/S. N = 41 cells for −Dox, N = 39 for +Dox, N = 44 for +Dox +Centrinone in G1/S/G2/M, and N = 35 for +Dox +Centrinone in G1/S. Brown-Forsythe and Welch one-way ANOVA with Dunnett’s multiple comparisons test. Error bars represent mean ± SEM. F Fold change in G1 tetraploids in control RPE-1 FUCCI cells (−Dox), BRAFV600E-expressing RPE-1 FUCCI cells (+Dox) and BRAFV600E-expressing RPE-1 FUCCI cells treated with Centrinone (+Dox +cent.). Fold changes are expressed relative to the control cells. N = 3 independent experiments. One-way ANOVA with Tukey’s multiple comparisons test. Error bars represent mean ± SEM. |