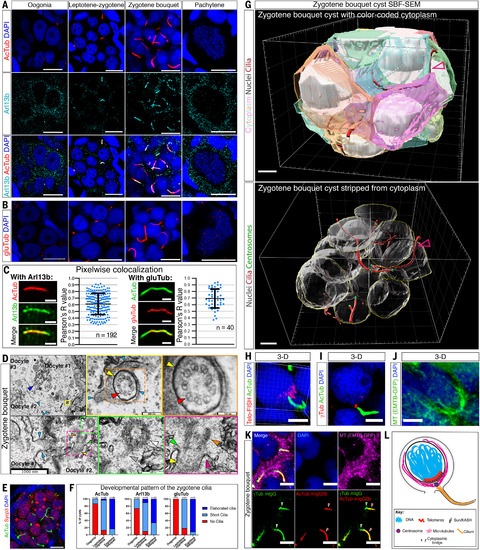
Fig. 1. A zygotene-specific oocyte cilium. (A) AcTub and Arl13b labeling shown at the indicated stages (n = 28 cysts in n = 8 ovaries). Scale bars for cyst panels, 5 μm. Scale bars for pachytene panels, 10 μm. (B) GluTub labeling shown as in (A) (n = 82 cysts in n = 7 ovaries). Scale bars are as in (A). (C) Pixelwise colocalization test for AcTub and Arl13b and for AcTub and gluTub. n, number of cilia. Bars are mean ± standard deviation (SD). (D) TEM images of cilia in leptotene-zygotene oocytes. Top left panel: leptotene-zygotene oocytes (dark-blue arrowhead indicates presumptive synapsed chromosomes interfacing the NE) within a germline cyst (light-blue arrowheads - cytoplasmic bridges. Right panels show cross-section of a ciliary axoneme, in higher magnifications (color-coded boxes), including ciliary membrane (yellow arrow) and MT doublets (red arrow), between oocyte membranes (light-blue arrowheads). Bottom panels: ciliary structures adjacent to a cytoplasmic bridge (light-blue arrows), including centriole (white), linker (gray), basal body (orange) transition zone (green), ciliary pockets (pink), axoneme (yellow), shown in higher magnifications (color-coded boxes in right panels). Scale bars are indicated. n = 23 oocytes in n = 5 ovaries. (E) AcTub and Sycp3 labeling shown in a zygotene cyst. n = 24 cysts in n = 2 ovaries. Scale bar, 10 μm. (F) The developmental distribution of the zygotene cilia as detected by AcTub (n > 100 ovaries), Arl13b (n = 18 ovaries), and GluTub (n = 11 ovaries). n = number of cysts. (G) 3D rendering of a zygotene bouquet cyst from SBF-SEM data, showing: cytoplasm of cyst oocytes (different transparent colors), nuclei (gray), cilia (maroon; maroon-gray arrowhead), and basal body centrosomes (green). Bottom panel: same cyst render stripped from cytoplasm to show the cilia. Scale bars are 5 μm. (H to J) Zygotene bouquet oocytes from ovaries labeled for (Scale bars are 5 μm): (H) Telomeres (Telo-FISH) and AcTub showing that the cilium emanates from the cytoplasm apposing the telomere cluster. n = 3 ovaries. A snapshot from 3D construction in movie S7. (I) γTub and AcTub showing that the cilium emanates from the centrosome, which was shown to localize apposing the telomere cluster (10). n = 5 ovaries. (J) Microtubules [Tg(βact:EMTB-3XGFP)] showing perinuclear cables (nucleus is counterstained with DAPI). n = 7 ovaries. A snapshot from 3D construction in movie S8. Another example is shown in movie S9. (K) Co-labeling of microtubules (EMTB-GFP), γTub, AcTub, and DAPI, reveals that the zygotene cilium emanate from the centrosome, which is embedded in a perinuclear microtubule network. A merged image and all individual channels are shown. n = 5 ovaries. γTub (mIgG1) and AcTub (mIgG2b) antibodies are both isoforms of mIgG. We used mIgG secondary antibody that binds both primary γTub and AcTuB antibodies, and a mIgG2b secondary antibody that specifically binds to the AcTuB antibody and not γTub antibody (arrowheads in the three bottom panels). (L) Scheme showing the bouquet cytoplasmic cable system.
|
